Revealing Division 1 Golf Scoring Benchmarks
Connor Stirling Peterson breaks down what Division I golf requires using scoring differential, the metric that matters more than rankings. Junior golfers improve about 1.19 shots per year on average, and he shows how UCLA-recruited players differ from peers in GIR, putts, and distance off the tee.
Chapters
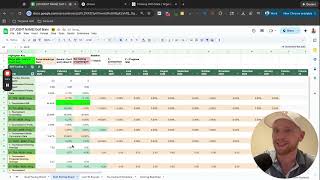
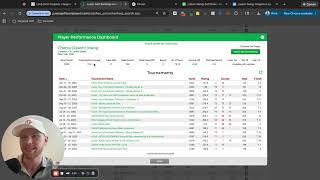
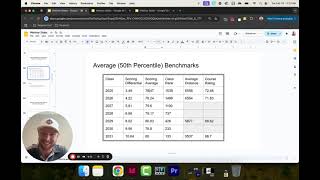
Going on, guys. In today's video, I'm going to be covering the average benchmarks for junior golf and what is actually required to play Division 1 golf and the benchmarks that you want to look for, uh, for that level of performance. If you enjoy this video, please go ahead and leave it a like, and it helps push it out to more people. If you're a returning subscriber, welcome back. If you're new here, this is all we cover is helping junior golfers develop to play Division 1 golf and actually showing you guys what it takes. This isn't going to be a bunch of fluff. We're going to go to hard numbers so you guys have clarity on what your child needs to do to play Division 1 golf. So let's go ahead and jump right into it. So I've got a webinar that I'm preparing for, you know, this upcoming Friday here, and I wanted to share with you guys some of the slides that I put together for that webinar just based on some new data that I've went ahead and actually collected to make sure that the webinar is impactful as possible. If If you're watching this and you still haven't registered for that, there'll be a link below this video, um, where you can go ahead and register. Well, let's go ahead and just jump right into this. So I think one of the things that I always like to start with is like, what is average, right? Because we can go into whatever our goals are, but if we don't kind of have a benchmark of just like, where should we be at? Or where's average? It makes it very difficult for us to really set, uh, reasonable goals. You know, for example, I could say, hey, I'm starting in business. I guess Jeff Bezos makes $100 billion a year, whatever, that must be what people make in business. And if I go out and make $1 million, that could be upsetting for me, right? On the flip side though, if I had the expectation most business owners, you know, don't do particularly well and, you know, don't really make any money, and I go make $100,000, I'm gonna feel very good about that. So a lot of, you know, where, where we, um, what we expect out of ourselves and how we feel about that has to do with what our expectations are. And that's true in junior golf as much as everything else. So I think it's just a helpful place to start of what is the 50th percentile, the middle of every ranked class. And so this goes back from— we've got seniors, junior, sophomore, freshman, 8th grade, 9th grade, or 8th grade, 7th grade, 6th grade, right? So that's kind of typically I'm working with players who are between 10 and 16 years old. So this kind of maps fairly nicely their scoring differentials respectively. It's kind of what the middle of the class is. Um, what their scoring average is respectively, their class rank. I don't have all of the distances just because I didn't want to go through this and do every single one, but pretty much I took all these players, added up their yardages, divided by the number of, you know, courses, just so we can have a perspective on how much longer do these golf courses get over time. And then the course rating on average for these, um, for these tournaments. And so when we're looking at this data, we can actually learn a lot from it. Apologize here, I had to stop the video real quick because I knew that that course rating looked incorrect. So it's actually 72.48. Anyway, um, so scoring differential is the primary thing that drives a player's ranking. Scoring differential is essentially the difference between their average score and the difficulty of the tournaments that they're playing. So this divided— or as compared to, to this. It's not 100% that, it's the top 75% of scores. But again, we can't control making sure the top 75% of our scores are good. All we can really control is the average, so that's where I like to focus. Um, but what you can kind of see here, this is a good benchmark for how much a player is improving year over year, because we can't just say what did scoring average do, because what, what if the golf courses got harder, right? It's not a fair representation. Say, well, you're shooting the same scores. It's like, yeah, but the golf courses are longer. So this is kind of the way that I like to measure, you know, how much is a player improving year over year. And so if we kind of look at this, you know, we're able to kind of do some interesting things. What this shows us is that the average player— average, these are all unique individuals, but on average across a pretty good swath of data— the average player improves by about 1.19 shots per year. And of that 1.19 shots, only about 0.25% or 0.25 shots of that improvement is actually from a lower scoring average. Okay, you will also notice here, and this is one of the reasons why I caution families against looking at the overall class ranking, especially when they have younger kids, is the class ranking gets progressively worse. Not because these players are worse relative to their entire class— these are all 50, at right at the 50 percentile— it's because more total players are in the class, right? So you can just do the math here. There's about 3,000 seniors, there's about 2,800, 2,900, um, or probably 3,000 juniors, about 22— you, you guys can do the math here. Anyway, you got significantly more people in the class, so it's not something you want to pay— if you got like the best, you know, um, junior golfer in the country or something like that and they're 10, doesn't really tell you that much. And so that's not to say don't try, but that's just not the metric you want you want to look at. In my opinion, there are two metrics you want to look— two metrics that make up the primary metric. You want to look at where the scoring differential is. The scoring differential is going to be a byproduct of the scoring average and the course rating. Hopefully that makes sense. Um, so if you've got a 10-year-old, the focus should not be, oh, they're the best player in their class, or they won this tournament, or whatever. None of that stuff really matters. What the focus should be is, hey, your scoring average is here, wherever it is, and we either want to bring that scoring average down or we want to play harder golf courses and keep the scoring average at the same level. And, you know, we want to do that over a long period of time, right? Ideally, we want to do both of those at the same time. And, you know, to be clear, we don't want to be chasing scores. We want to actually develop the skills that cause those scores to happen, right? And, you know, that's something that I get in with, you know, my programs when I'm working with junior golfers. Yes, we're looking at their statistics like this. We're also digging deeper and saying, okay, why do we shoot the scores we shoot on average? What are the core skills we need to focus on? How, you know, how do we map all that out statistically? How should our practice look? What drills should we be doing? How much time should we be spending? How often should we be playing golf? All that stuff. I do that for them specifically, and we meet every single week. If that's something you're interested in, there'll be a link below to apply for that program. But again, just kind of getting back into the video, um, that's what you want to be able to do for your child's situation, to be able to improve as fast as possible. But anyway, let's go ahead and get back into it. You can kind of understand here that there is a hard ceiling on the average. Um, players are not really getting better than essentially like 79, 78. And it doesn't matter if they're young or older, it's not really a big difference. I will say that the average, you know, year over year, golf courses increase in length by about 170 yards, which is about 9 yards per hole. So if you're trying to like model out How much yardage do you want to, you know, have as a minimum that your child is going to hit the ball further? It's going to be 9 yards, um, year over year is what you're going to want to aim for. Oh, I just had to pause this video to do a little bit of quick math for you guys, um, but just so you have perspective on that, 9 yards is going to translate— assuming we kind of have optimal mechanics here— 9 yards is going to translate to about 5 more miles per hour of ball speed. And assuming we're getting a 1.5 smash factor on our driver, which would be ideal, you know, that, that's kind of what we aim for, then need to increase clubhead speed year over year by about 2.5 miles per hour. So whether your child is only swinging 100 miles an hour or 90 miles an hour or 115 miles an hour, that's kind of a good target to set, at least until they're in the range of 115, 120 miles an hour is kind of like the upper range. A whole lot more than that, it can be an advantage for sure, but you get more into a game of just find your golf ball and a little bit less of needing to do anything, but that's crazy. Um, is that crazy? Also just recalling that this was about— yeah, that, that looks right. Cool. So anyway, I just want to make sure that, that this distance number was correct. But anyway, you guys can kind of model out here. Here's kind of a perspective on average. You can kind of, you know, judge where your child is at versus these averages. Now let's kind of go into the next level of this because you might be wondering yourself, okay, cool, the average player improves about 1.19 shots per year. Is that different for 8th elite players. Because this is also going to be very helpful for you if your child is ranked, then you can literally do the math on like, are they going to play Division 1 golf? Just do they have a high probability of making that happen? Um, because, you know, let's say that they have a scoring differential of 8, and, you know, in this case they'd be, you know, whatever, 8th grader. So they've essentially got 4 years ahead of them in order to improve and play Division 1 golf. Well, if they improve by just the average here, which again, that's— there's a decent probability that they could perform worse than the average, and you want to be realistic about that. Well, you know, that player is going to improve by just under 5 shots, and that's going to leave them with a scoring differential of about 3.26, right? Which is still not Division 1 golf. Division 1 golf is going to be -1 or probably better, closer to -2, depending on kind of where your child is at. The lower the better, obviously. But if you're average and you improve at an average rate right now, you're not going to be able to pick up that ground. Um, so again, just having that perspective can help you make decisions about what you might want to do. And if you're not measuring any of this stuff, well, this is kind of your signal to start measuring this stuff so you can actually model out predictable improvement here. Because also a lot of the, the distance, a lot of the improvement that typically players are seeing is just because they're hitting the ball further, which is something for you to ask yourself, okay, why are scores not coming down? And the only thing that's really improving is your overall, um, distance, which should happen because you're getting bigger. You can kind of ask yourself a question of like, okay, well, how much are we spending on instruction, and is it causing the improvement that we want to see in a real measurable way? Not just in like, hey, it feels good right now, but we can actually prove this with data. But moving on, one of the questions you might be asking is like, is this different for elite players? And I had the same question, and what I kind of found was exactly the same statistic. So this is 8 or I'm sorry, 6 randomly chosen, um, top 50 players for the— for their junior year. And I looked at their trend report to say, okay, cool, where were they a year ago and how are— where are they at today? So this is where they're at today— or I'm sorry, this is where they were at a year ago. This is where they're at today. So they're all pretty similar. You guys can see they're like right next to each other, just one after the other. And this is the amount that they've improved over the last 12 months. So a couple of these players got worse over the last 12 months, a couple of them got, you know, substantially better. I would say almost 3 shots, really, really good. Yeah, 3.6 shots, really, really good. Um, these other ones, about half a shot, definitely under average. But again, all in all, the average is about 1.19 shots per year. And so again, when you're modeling this stuff out, it's not like— I bet you every single one of these kids is working with an elite-level coach where they're paying them, you know, $150, $200, $300, $400, $500 per hour, and this is still the improvement that they're seeing in just a randomly taken sample. I think these are right next to each other. And so again, when you are modeling out for your child to say, okay, you know, what's realistic and what might we need to do to get on track, these are things that you want to think about, um, and this is data that you really want to think with. The last thing I want to do for you guys is show an example here of one of the students that I've worked with over the last few years and compare them to average, just so again you can kind of see this. So, you know, this top player got recruited to UCLA and class of 2026, currently at— putting together this chart— had a scoring differential of -4.53, scoring average roughly 72, class rank 37, average distance on the golf course was 6,882, and average course rating was 7,381. Compared to average, 4.22, scoring average of roughly 78. Class rank's obviously a lot higher. Distance on the golf course is about 300 yards shorter, and the average course rating is about 2 shots worse. So we kind of consider this— about 6 shots of this is accommodated by the difference in scoring average, and we've got another couple shots that are accounted for in the overall difficulty of the golf courses. And we've got about 18 yards longer per hole. So if you just kind of think about really breaking these things into chunks rather than looking at this player and saying, hmm, you know, we just need to win tournaments or whatever. You can be a lot more clear about like, okay, we need to drop 6 shots off of our scoring average in order to get to our goals, and we also have to play in harder tournaments or, you know, realistically longer golf tournaments, which helps us prioritize. Okay, we need to prioritize distance off the tee, we need to prioritize at the same time as that, or we need to prioritize being more accurate from, from greater distances. And then we also need to prioritize the other skills that are going to cause us to go from 78 to 72. Now, a lot of people out there talk about like playing scratch golf. A lot of people out there talk about improving skills to be able to shoot, you know, scratch golf. Um, but it's really important that you can actually quantify this stuff down to what are the specific statistics that we want to see in order to do that. So I'll give you guys a quick example of this. When I'm working with my students, one of the statistics that I love to see is if we've got a greens and regulation over 7 at or over 70%, it's a beautiful place to be because they can kind of suck at everything. But if they're hitting 70% of their greens, they're just not going to shoot high scores. Like, they might not shoot low scores, but they're not going to shoot high scores. They might be shooting in the 80s very often. And so if we have that combination of that, and let's say, you know, we have a very low 3-putt rate, we're 3-putting, you know, perhaps once or less than one time per round, then we just have a very low probability of being able to shoot high scores, you know, short of hitting penalty balls off the tee and every single time we don't have a penalty shot, you we hit the green regulation, um, you know, we're able to be very clear about like what that player needs to do. And vice versa, if we look at a player and say, okay, cool, you know, our 3-putt rate is 15%, um, you know, maybe our greens regulation is 40%, uh, maybe our penalty rate's 10% off the tee, we can be very strategic about how we attack that in order of what's going to have the biggest impact. So that's again something that I do with my students, to be a little bit more data-driven with this stuff. On average, I see players improve by somewhere between 3.9 and 3.2, depending on, you know, which— whether you want to use the mean average or the median average. I got one player who's improved by like 10 shots. It kind of drags the mean up, but the median is about 1.27 or something like that. I'll be sharing more in-detail data on the webinar on those specific numbers and kind of just showing the behind the scenes of how we get to those numbers. But also, like, this is the approach that you guys want to take, and the approach that I've found works very well. You know, at least it's 3 times better than average. Um, so if you guys are interested in that, again, there'll be an application below. Uh, if you want to get help for your child and you're looking at their average numbers, or they're looking at their Junior Golf Scoreboard ranking and might be saying, okay, cool, either we're on pace, in which case congratulations, or, you know, maybe we're a little bit behind pace, or you're just in a situation where you want to make sure that your child improves as much as they're possibly capable of. They just get their full potential. Um, so hopefully you guys enjoyed this video. Hopefully you guys enjoyed going into the numbers. I know it can be a little bit difficult to parse through and really digest, but you guys can watch this video multiple times. Hopefully you guys learned something about another perspective on where your child might be at and what they can do to accomplish their goals. All right, I'll see you guys in the next one.