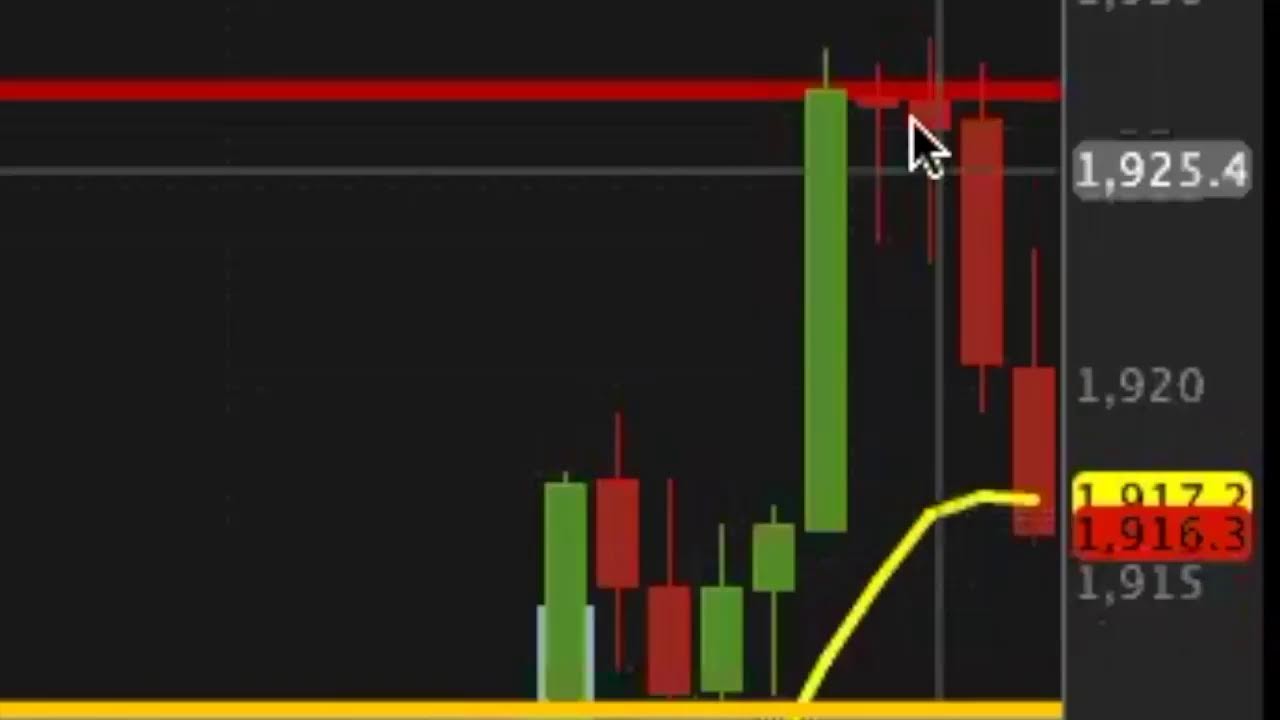
A trader walks through a recent trade using candlestick patterns, support and resistance zones, EMA, and MACD. He shows how multiple-wick candles that reject at resistance can signal reversals before indicators catch up, and explains his approach to adjusting levels as price moves and waiting for confirmed setups before entering.
Chapters
Good morning, AI Day Traders, and happy Friday, right? We will talk about this on Monday, but I just wanted to show an example of— we learned, um, last Monday about, you know, we started getting familiar with candles and how they act when they get to areas of support and resistance. So I just wanted to point out, uh, in this actual trade how when my resistance level was set up here because it came here and stopped, got rejected, got rejected here, rejected again. So we have that multiple wick candle that we were talking about. And even though— then this is what I want to point out— even though the EMA at the time, right, it was still up and the MACD was still up, this indication where price action, right, because price action is the leading indicator. Now you can see Yeah, things are starting to change a little bit, right? The MACD is dipping down, but the beginning of it started with the price action. Okay, so I just wanted to share the multiple wicks, and then we had a nice reversal that came down from 1926 down to 1920. So a 6-point reversal. Okay, now it's coming and hitting here. Now what this tells me is that— and then it stopped here and started to reverse. So I may move this up To now my new area of support. Okay, now that doesn't mean I just would have taken a trade right off of there. I mean, you could have, but what I like to try to wait for is to get the new setup. Where is my new level of support going to be? Okay, and where is my level of resistance going to be? And what's going to happen now if this continues to go down and break through it? This is— gives— will give me confirmation that the trend is starting to change, right? It's confirming, right, that it's still going down, as you can see. Okay, so you can move this thing around as much as you need to, right, to see where your levels are going to be at. But that's how you start to figure out what your next trade is. Now let's talk about momentum candle, right? So this candle has momentum off of the previous 2, right, which is showing us in real time How this candle, you know, is continuing that reversal. All right. So if you were confident about what you've seen with the three wicks rejecting, and I probably should be in this trade, but I'm gonna coach you guys through it while this is happening. I've already got my points for the day. So you know when I look at where I'm at, I got four ten already for the day. So I'm not really trying to do too much, but I thought it was a good opportunity to just have a conversation about what we learned on Monday and even here. Where my support line was at originally. You see it came down, right? Wick rejected at the top, short wick here. Even the green one had a wick, boom, and then it reversed and went up. So none of it is guaranteed, but if you follow the patterns of the market behavior, you'll be in a better position to take better trades. So we'll talk about this more on my