Day 65-Metrics Mastry for Designer-Job Special Hackthon V2.0
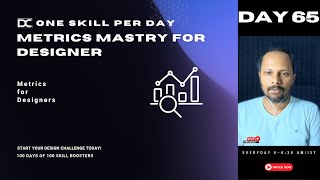
This is a YouTube video titled "Day 65-Metrics Mastry for Designer-Job Special Hackthon V2.0" created on November 26, 2024. The content type and title suggest it is likely a tutorial or presentation related to mastering metrics for designers in the context of a job-focused hackathon. No conversational dialogue or multiple speakers are evident from the excerpt.
It. Yes guys. So now okay we have gone live in the YouTube guys. Because 30 minutes is for the YouTube live as well. This is also for the people who are watching from various other places. And there are a lot of students who also join on the early morning session in the YouTube. Yeah. So today we are discussing about this metrics. Mastery in design. Okay. And people are doing the live activity. So now what's the initial question? Okay, what was the initial question Shashank is taking? Okay fine Shashank. So the initial question was you'll have to just look around you. What is the real annoying issue across you? Like let's say you must have read in the newspaper. You must have read in the media. Okay just try to join little early guys because if we start repeating it will take time. But anyway no problem. I totally understand. So you will have to just write down what is one issue guys around you. And you just collected three stat information statistics for that using some online. Like let's say you took Google or chat GPT whatever you took some issue. Okay so Purva is saying public transportation. That's a great thing. Okay so Shashank you might write something. Okay just. Just do it fast. Meanwhile I explain the other things. Okay so now you guys have collected three statistics information. Now below that don't look at the online. Okay now go to that sheet. Where have you collected this data? Or maybe you've written in the paper. No problem. Just can you write at least two insights from the statistics. What is mean by insight? Okay, I'll tell you what is mean by insight. Okay, like let's say if you're watching. Like let's say in. In the newspaper. You're. You're reading something like this. Like let's say seven people died in the road accidents yesterday at the same place in a district called in. In a. In a. In a city called Bhopal. Okay. And one of the police officer got killed. Let's say you're reading this newspaper. Okay there is some number here. There is one information. It's a statistics. Okay, it's some statistics also an information. And also you're reading one more information called. Every year on the road close to 13 million people get into road accidents. More than 30 percentage people lose their life. This is one statistics. I'm just taking one hypothetical case. Okay, you're reading this in the newspaper. Same like what you have in front of you. Now reading this. What will you infer from this? This is called insight. Maybe like let's say if Jagdish is reading this information I can see. Even police people are not following the rules sometimes. Or maybe they have not worn the helmets or something. They have got into the problem and died. And also government is not taking proper action creating a proper roads. That is why this much millions of people are dying every single day. And no healthcare facility is there. That is why even after they go to the hospital they are not able to get saved. Three insights I got from this. It may be true. It may not be true. That is not the problem. But if other people are reading this, they can see. Okay. Last year 14 million people died. This time 13 million people only died. It is better. Government has taken some initiatives. This guy knows the earlier data. Okay. I did not know the earlier data. This guy is saying yeah. Government is doing phenomenal job. It is better. We'll try to reduce it even more further in the coming years. Super Hindu newspaper has published the statistics. Excellent. Police has died. What to do? Anybody who follows, anybody who doesn't follow the rules will going to die. Okay. So each and every people will interfere and interpret this information very differently. So what is your three or two inferences from this data? What you collected. Okay. Write it in your own style. I wanted you to write it as a story. I wanted you to write it as a line. Because insights should be in the lines. Okay. Insights. Insights cannot be one word. That's called. That's not called inside. Then. Okay. So you'll have to build a story around it. Okay. Muthu has taken bike accident. No problem. Mutu, you take whatever you want. No problem. Topic is yours. Correct. Three start and then write down the inference around it. Okay. It 30 seconds. Just write it down. What is your inference from it? You can do a multiple secondary analysis also in the online and take it. No problem. But I just need a small story out of it. There should be a meaning of what you collected and. And what you're trying to say. Okay. And be ready. You have to open the mic and talk. Now. There is no typing in the chat box. And all you need to from the heart talk. What did you infer? Guys, people are little joining late. What do I do? How do these people will pick up? That's okay. No problem. If they watch the recording at least they can fully watch. But in between if you come then you will miss the flow. No problem. But anyway just try to get along. Fine. Just help out others. Guys, if you can able to type out in the chat a little bit context what's happening so that that will be better. Okay. Fine. Guys. So now I wanted you to open your mic and anybody any volunteer can talk. What are the inference you got out of this stat? Go ahead. What are the inference you got out of this stat? Tell me. Muthu Kumar Sai or Ramraj Darun. Anybody? I'm just reading some random names but you guys can take it. Okay guys please switch on your camera. I request everybody to switch on your camera. Because this is not a group call. This is a personalized call. Please just open the camera and any doubts. Interaction is going to be live. Okay. So take advantage. Yes. Yes. Yes. Go ahead guys. Who wants to just talk? Shantiral, can you talk? What did you. Did you collect inference? First tell me. You are in mute. Shantilal. Yes sir. I can't. Yeah. Yes. I have started that. Yeah, you can tell me. Damage roads. Damage roads. Okay. What are the statistics you collected? Tell me. Statics means around 30 km of roads in area like in Madway or damaged with some left as gravel making travel risky. And it can give you some major accents like major accidents ongoing impact out of 115km of roads planned for Many are delayed due to dry range work and other issues. Right? That's good. So this is one statistics and also a reason. So many are due to rainy reasons. It's your insight, right? Yes sir. Okay. What is the other insight which you can take from this? Any. Any. Any one more inside. So you are saying this much of roads are getting damaged and people were not able to do. And what are the other insight you can take? Tell me. Up to 50,000 people face trouble during this road setting areas and it can leading to the vehicle damage and the business process also. Okay fine. This is a one way to take. Okay. The second way to take is lot of people are wasting their time in their roads. Their entire productive time is getting into the roads. Right? So you can think about. Okay. Being a designer can I able to first solve this problem? People are now spending on average like let's say I'm taking one case of Shanti Rao. But your problem may be very different. But just I can't address all of the problems. But I'm just taking one example. Okay. See you may be really thinking this is just a vague problem. But listen to me very carefully how we can make a sense out of it. So much of people are traveling in the day for the office, school, colleges or public anywhere they are going outside. Okay. Because of this road that problem has happened. They were close to 1500-2000 people on an average every single day are wasting their time Going to their office on time. Like let's say if you take 15 to 20 minutes delay for that particular one person, imagine the 15 minutes is same for the others, right? Imagine into 1500 people, into 15 minutes, how much it is more than lot of months. And I would say if not years, maybe at least months. So those much of time is wasted because of that problem. So now you made a difference out of it. See that was a different statistics, right? What Shanti Rail collected. But I am able to read it in a far more different way. How? Being a designer, you need to think about what is the real hidden problem behind it. This is the first skill of your researcher to understand when you're collecting the information, when you're doing a primary research, even when you're doing the secondary research. What you did is a secondary research. Exactly. Okay, remember guys, when you collect some information from the field like let's say, okay, according to me people are. People are. People are getting into a lot of brain related problem because of this electromagnetic waves, because of what the phone is emitting. This is called assumption. This is own biases. Okay. You can say according to a study by University of Chicago or whatever, Harvard Business Review, there is a considerable amount of impact which is happening to the human brain because of this electromagnetic waves. This is called secondary information. Because you collected somewhere this information. Okay. And then you are inferring this and this is true and a fact to a certain extent. Okay. Because this has been proved. There is another information. I have personally visited a hospital and then the doctor got me the report that this guy's brain was affected by the electromagnetic waves which was emitting from this mobile. And this range of electromagnetic wave is this much. This is called primary research. How many of you understood the three case what I said Type you in the chat box if you understood the three examples what I said. Okay, see. Can you first type out you. If you guys understand or if you are not understanding, just type in you. I'll explain again. Not a problem. Okay. Okay. That's great. I think people are getting it. Thank you. Thank you. Fine. So the first what people have did is assumption. Jagdish. I think transportation is a problem. I think bike accident is a problem. A lot of people have typed different different problems. That's okay. The moment when you collected some statistics and information, it is becoming real. That's called the secondary information. And the moment when you go into the field and then you start collecting some information that is called primary source of information. You are not believing in any statistics. You are Believing in the real time report or some data which you collected. Like let's say if you're asking a person. Hey Shantila. Like let's say I'll take one more example. Okay. I'll take one more example. Okay. Shantilal, every day how much people do you see are starving for the food on the streets? Example, I'm asking. Okay. It is nearly 15 to 20 people. Okay. Every day 15 to 20 people. Okay. So I am telling one data. Like let's say I can see more than 20 to 30 people. Okay. And let's say if I ask Neetu, she will say one number. Darun, she will say one number. Purva will say one number. They're collecting information. Okay. 25. Shantilal Jagdish. 20. Tarun. 15. Sri Balaji. 0. Oh Shree Balaji. Where are you living? I'm living in a place called Hill station. And nobody's begging there. That's okay. That's an information. Thank you. Zero. Another person. Zero. Another person. Hundred. Where are you living? I'm living in a third world country like Africa and Somalia. Where this is very, very common. And it's. It's mean. It's very pretty common. Okay. 100. What you did is actually called a quantitative research. How many of you understood this type of Q U? Quantitative type Q? If you understood what. What you said. Okay. We are going to see another example. Quantitative. We are not asking why but we are asking how much? How much? How much? What's your salary? What's your salary? What's your salary? What's your salary? What's your salary? Okay. 2 lakhs. 3 lakhs. Okay. The average is 50,000. Good. So the average Indian salary is 50,000. How can we increase this? Being a designer, how can we try to increase this? By creating a product or a service or maybe a productivity system or maybe something. See, you are now making a sense out of the small data. What you got? Now let me take another stance. I'm asking. Hey Shantilal, you said 20 people are begging. What do you think is the reason? The moment if I ask this then Shantilal will start talking stories like this. India is like this. We are poverty, British this. That we will tell everything. Right? So everybody has a different insight to tell this. Or some people will even justify with the fact. But yeah, what I just asked is an open ended question. That means I'm just asking Shantilal a open ended question. He can answer anything. First what I asked is a closed question. He can only answer yes or no. Right. He can only answer number. He can say I don't know, he can say 20. Can he answer something else? I mean, he can't answer anything else if he's trying to answer it. Probably he's not answering your question. Simple. Okay, so what you now did is a qualitative research type qa. Qualitative approach. This is called qualitative. So how many of you understood qa? Q U? Primary secondary fact assumption. Okay. Yes. That's great. Superb. This is a small context, guys, you need to understand this, okay? Because we are not designers. We are problem finders and problem solvers. Please understand this. You may be fancy names putting, I am aspiring UI UX designer to get job. You are just putting like that. But end of the day you are a very keen observer and you are trying to read the numbers and you're trying to make a sense. The moment when you understand this, your entire design journey will be very easy. Learning skill is not a big deal. Getting this mindset is very important. Lot of people think this as a very complex subject and they don't understand and they, they think, why do I need this? Give me some data, let me build the screen. No, this field is not like that. Probably you end up in the wrong program if you're asking me like this. Okay, so think about it. This is the major important thing. So with that context being said now I needed you to keep this data with you guys. Okay? Now we'll jump into certain important factors of it. Fine. So this is a small activity, what you guys did. So the main context. Guys, please help me allow this people, whoever is joining, there are a lot of people who are joining you. Thank you guys. And I'll also make Shantilal as a co host, Aravind as a co host so that you guys can also help others people to join. Okay, what do I do with Shantilal? Just a second. Okay, Shantilal, just help me out. Okay. Allow these people and ask them to switch on their camera. Okay. So understanding and leveraging the key metrics aligns design work with the business goal and demonstrate the value. Okay. What we've seen so far is just our data. We know a lot of things. We just kept the numbers. We just did it. But can you align it with the business goal? See, a lot of people said garbage lying on the street. You will not believe there is a company called Honeywell. How many of you know Honeywell? Honeywell is one of the big, what you call service providers and their solution providers in the globe. Okay. Honeywell has A design studio. How many of you don't know? Honeywell offers 70,000 for an internal. They are very crazy. Okay. I mean this is one such studio which offers a crazy salary for even an intern. If you're selecting as a designer, they'll pay you 18, 20 LPA. Okay. Being a fresher, I'm saying. So the point here is Honeywell has did a project recently. Two to three years before. Okay. So what they did is they. They find out something called smart waste management. So what they did is government or some third party has approached these people and they said a lot of people are throwing waste garbage. A lot of people living in the cities like let's say Bangalore, Chennai, they only targeted the what you call the urban cities. The urban are the little bit suburban. So what Honeywell did is they tried to solve this problem by asking a lot of questions to the people. They came up with a mobile application called Smart waste management app where they can able to also monetize the waste. What people can able to do? Because waste is a huge economy in India. How many of you don't know this? We are actually wasting lot of waste. We are wasting lot of waste. The point here is lot of people are upselling this waste. There are millions of tons of waste which is going into the garbage which can be recycled. That means recycling is one part. Upcycling is one part. Like let's say if I am able to recycle this like let's say a cotton, whatever have. Okay. And I can able to what you call put it into another form of a material that is called recycling. What does mean by upcycling? If I'm able to create a craft out of it, but this is not going to harm anybody. I can able to sanitize this. I can able to clean the germs and I can able to build a good craft around it and I can able to sell it for like let's say 15, 20 rupees from the 0 rupees. This is called upcycling. Okay, I'm just taking a small example. We are not reading about upcycling recycling. But I'm telling the economy is very different for these people. So what Honeywell has did, they invented a solution like people can able to put their waste. Let's say If I have 10kg of paper or maybe a cardboard or anything, I can able to put it in that app. I don't want this. I just need 50 rupees or maybe 100 rupees to guide you. Ramraj may need this. Hey Baba, I need you this. If I go to the shop it is 500. I will pay you 50 rupees GPA you send me. Or maybe your house is nearby, I can collect it. See, this is a small economy they created. Okay, so you guys can solve any problem out of the small data, what you got? Close to 25 million tons of waste is generated in India. How many of you don't know this? This is a stat real time information. 25 million tons of waste is generated in India. So Honeywell has took the different perspective. But are you guys taking a different perspective or not? That's up to you. What Honeywell has did is they have take the project. They took the project and they've aligned their business goal. What is the business goal? They've created a value out of it. And each and every subscription, what they downloaded in the mobile and transaction they make. Honeywell or the company who created that application is going to make the what you call platform charges. Even if you use paytm, even if you use Google Pay, there are the platform charges. Do you think Playtime is a charity company? They're not charity guys, okay? They're having some business value for it. Okay? Each and every transaction you make, they get the commission, they get the profit. How PAYTM designers are paid, how PAYTM engineers are paid, how PAYTM developers are paid is because of the platform charges, right? So each and every platform, whether it's a digital or physical, you have a charges for it. Okay? So your end of the problem should meet the business goal. The business goal could be revenues. The business goal could be having lot of customers. The business goal could be engagement, it could be anything. But if you can't able to generate and meet this goal, you are not solving any problem. You are just making some fun with design. Okay? So anything which improves or decreased only when it's measured. How many of you understood this statement? This was said by a guy called, He's a all time management guru. He's like 100 years old guy. Okay, I forgot his name, I'll tell you that. Okay, this guy only said this. He's a, he's an all time management guru. He's, he's number one in like let's say management in the world. I would say he died long back. But this guy has written this word. You cannot really measure. I mean you cannot tell which is improved or decreased unless it is measured. What is your weight one year ago, what is your weight now? You have increased in your weight. That means you put fat, you you got lean? Oh, I'm getting into some problem. How doctors will reduce. How doctors will diagnose a problem with you only through numbers. How people can able to read your financial data only through numbers. Everything is made up of number guys. The more sensible you are able to create a meaning out of it. It's up to you to see the problem on its own. If you're not able to do it, then you will become a normal designer. Okay, so first of all let's understand the small statistics. Companies who track their design performance metrics are two times more likely to succeed. McKinsey Design Index in 2021 has said that. And designers presenting the data backed with decisions are 40% more likely to gain stakeholder approval. Adobe State of Create report said that. The reason being you need to know how to track the data. Adobe is a creative software tool of people know about this, right? They have conducted the research. It's not only creativity. You need to know how to read the numbers carefully. Okay? Metrics based design is essential for measuring the UIUX impact on return on investment and business performance. How many of you know what is roi? Type out on the chat. Yes Jagdish, I know what is roi? I'll tell you simply. Whatever you invested for your education, you should get it back. That's called return on investment. How fast you're able to get it, that's up to you. Okay, so return on investment means business has invested some money. So you need to understand how to take it forward, how to get it, how to multiply it, how to really amplify it in a large more different way. Okay? Yes guys. Correct. Correct. Correct. Everybody is typing. Yes, yes. Good, good. Return on investment. Great. So this is called roi. Each and every business runs on that. So now let's understand the core concept of it. Okay, we'll go a little fast. Just pay close attention. I told you what is mean by qualitative quantitative. You don't have to understand it. Ok. And there is something called user retention rate. There is something called NET Promoter score. NPS is Net Promoter score. There is something called task success rate. There is something called conversion metrics. Jagdish, what is this word? J I am getting little scared. Don't worry about anything. Each and every company has a different metrics to track. You don't have to memorize these words right now for me if you understand this, this is more than sufficient. Okay? Because each and every company and the product is very different. Each and every services is different. Let's say if you work for A salesforce. Let's say if you work for a SaaS based company, the way in which they track the metrics is very different. If you work for an E commerce industry, they track it very different. If you work for a physical product design, they track the metrics very different. So don't memorize all these words. This is not a mandatory. I'm just telling you some examples. Okay. And you can able to use this smart technique to measure this specific, measurable, achievable, relevant time bound goals. Okay. This is how you measure. You will track it. Okay, I'll explain you one case study also over the time how we can able to get it. So there are many techniques to do it. Guys. There is something called OKR objectives and key results to link to the metrics to the outcome. There is something called user behavior tracking. We will see this in detail. Little bit. Don't worry about that part. And we'll also do a live activity. Don't worry about that thing. But now let's get into the tool part of it. Okay. So pay close attention guys. I needed you to now pay very close attention. Okay, first of all I'll open a screen now. Okay. So type out in the chat, what are the inference you're getting out of this? Okay, I'm just opening a screen now taken from the screenshot online. But I wanted you guys to now read. What are you making sense out of it? Okay, your time starts now. You read the statistics and made the inference, right? I wanted you to now look at the screen and make an inference. What are the insights you're making? Go ahead. Everybody is able to see the screen, right? Type out in the chat, take two insights. You want me to zoom it? I'll zoom it even further. Okay. Jagdish, I don't know what is mean by bounce rate. Just google it guys. Fast. I can't explain you now. Take any one or two insights from it. 20 seconds. Go to the left side, right side, top to bottom. I'm not able to infer anything. That's okay, no problem. Just at least observe the colors that could be your insights. You can tell. Hey Jagdish, blue colors are very soothing. So they are creating very soothing dashboard. That's an influence. That's okay, no problem. Most of the sessions are taken from people in North America. That's great insight, Shashank. Okay, little fairly direct but I can see that you watch this map and the blue regions. Excellent, Shashank. Excellent, Excellent. What about others? What are the inference are you getting? It's A dashboard. Some learning website. It shows the statistics of user. Okay. A little vague insight I would say. Can you go a little deeper? Can you go a little deeper? Ramraj, can you go a little deeper? It's good that you in the layer one. But can you go to the level two answer and try to find out? Okay. High numbers of users during between 2 to 8am that's great. Who was that net picky guy? Arun Crazier. That's great, guys. Can you see that? Can you see what Arun Murugan has said? User base is discreet in this week. Chavi. That's great, Chavi. Excellent. Users are spending 1 minute 39 seconds. Okay. There are no users right now. Superb, Dharma. Excellent. So you guys are trying to create a sense out of it. Okay, fine. Can you see this? Can you take one insight out of it? Now everybody has got warmed up what we are doing? Okay, I need everybody to type out of the chat. What are the one insight you are taking out of the screen? Come on. Go ahead. Don't tell me you can't read it. Just. Now get some clarity. If you can't understand a word, just open another tab. Put that word. Get the meaning fast. Okay. If you become design managers, this is. This is how your life will be. Okay? You guys are now starting up your career. So just relax. How many wants to. How many of you wants to become a design lead in the start of their career itself? If you really wanted to become a design managers product lead, you guys have to become very conversant with these numbers and all these things. Okay? Okay. Sha is saying rise in number of sessions after the 20th of February. That's a specific insight. Sh. Excellent. Paid searches. Paid search is bring in the most viewers. That's great, Shashank. Excellent insight. What about others? See, certain people are able to quickly grab something. Right? Certain people are not able to do it. That's fine. But remember this. This is a practice. This is a skill. This is a keen observation. If you start developing this guys. This sense, guys, you will be able to get far more data. Okay? Okay. Everything is measured. It's a quantifiable data. That's great, Ramraj. Super. Okay, you're getting into the topic. Great. Average user engagement was 22 million. M means million. Okay, fine. Excellent. How conversions are higher than viewers. How conversions are higher than viewers. That's okay. You. You understood the. You found out the mistake. That's okay. Fine. This is a sample screen, guys. Okay? See, the point is this is not like. Let's say this is Not a real time data. I took it from the online. Okay, but yeah, that observation is good, Muthu. I really appreciate that. I don't know what are the context this dashboard has been taken. This is one small dashboard which was taken by Google Analytics. Okay, how many of you know Google Analytics? Possibly lot of people will not know because only business owners knows about this. Okay. You need to have a business or some website or some kind of a tracking mechanism to actually put it in the Google. Because Google will not. You can't analyze a website like Apple or other website for Google Analytics. That's illegal. Okay, you can do your own website and like let's say if you have an e commerce website and you wanted to know how much people are engaging in your website, you want to increase your website, you can just tag this Google Analytics. It's a paid software. And also you can get the insight how much people are looking at it. Okay. Spike in user views on Valentine's Day. That's great, Shashank. Okay, so a lot of people are more keen towards that as well. I'm not able to see that. Where is that? Okay, February. That's great. Okay, so the point what I'm trying to tell you guys, there are many ways you can able to infer the data, right? See you as a business owner or you as a designer, or you as a lead product designer. Are you as an intern? It doesn't matter. For all of you, the dashboard is same. Numbers cannot lie. I may lie, personal opinion can be wrong. But numbers and statistics will not lie. So your skill being a designer is to make a sense out of it. Okay, in the Valentine's Day there is a spike happening. So you as a designer can say, hey, in our application, like let's say you're working in an e commerce industry, okay, you're selling some seasonal greeting cards and then you're saying you are some. What is that? You're sending this complimentary gifts. What are the name for that? What are the name for these people? Like let's say some office gifts and corporate gifts. Okay, Corporate gifts, you're saying? So you're saying, sir, what we can do is you are an intern. Okay, you're just intern. You're just joining this company. Sir, every year I analyze the company's data during only the seasonal time, like let's say Valentine's day and New year, our products are getting a lot of spike. So what we can able to do is we can create a special offer in our mobile app or a website app or tablet App or whatever. We can able to show all of our products at once. We can target a specific audience and we can give some offer. We can make it pop up in their screen so that people, once they look at that screen on that particular offer, they can able to grab lot of products. See, our competitor is Amazon, our competitor is Flipkart. They are not doing well. We can do this because we have the data in front of us which has proven a lot of people are spiking in our information on February 14th or maybe in the new year or maybe in the Christmas. So we guys can create a small dashboard or maybe offer page, something like that so that we can able to push our products and services. A lot of I'll take care of developing that pop up screens. I'll take care of development of that entire screen. I'll do a small research how much people are going to engage in that. I'll also do a backend analysis of what is really going to happen and how much people are going to purchase complementary products for their dear loved ones and how many people are going to get it for the new year. Let me take one data so that we can able to predict certain data to the sales and develop this. Let's say if this deployment takes millions of rupees to install it in your product, your boss will never say no because you are showing that you are going to get multiple millions in revenue by pushing your products. You are telling the numbers you are not telling. Sir, I like this pop up screen. Sir, we will put it in the website. Sir. This is very fancy. Sir, I like blue color. Sir, please, please use it. Sir. Your concept will never get sold. Your concept will never get approved by your managers. If you talk like this. If you really wanted to make your concept stand out. I'm telling for the interview, I'm telling for the design managers. Both are same guys. If you want to really tell that your concept is good, validate it with a number. Show that with a stat. If you're not able to do it, learn it. At least now this is the right time to learn it. Each and every project, what you have in your portfolio could be taken a data from that. Each and every case study what you have in your projects. Each and every information could be inferred as a data. And when you project it with a proper return on investment. I told about roi, right? Told about business metrics. People can able to easily get it. Yeah, the manager will say no matter what, we'll implement this. Imagine if you're beating Amazon and flipkart in this particular day, this big billion day and whatever, do you think your manager will stop it? He will in fact flush a lot of money to invest to create this more offer. Why don't we create an Instagram campaign for it? Lot of people will tell other way. Why don't we create advertisement for it? Yeah, we'll create it. I'll create a post for it. Let me create a small video for it. Let me create a small animation session for it so that people who are viewing in our social media pages can get the data. Okay? There is something going to happen in this company on February 14th and let me watch out to buy it. Any which ways they are going to buy something right for February 14th and you are creating the traction for it. You are bringing the traffic to your website, your product, your app, your physical store or anything. You can do anything, guys, whatever is your thought process, okay? But you are bringing the business to the business. You are bringing the business to the business. This is how you as a creative designer can read the data and start creating an interaction for it. Okay? Now this is one part. The second part is okay, once these people come into the website in the mobile app, in hoverslift, if there is a limiter available, people will be able to take a decision faster. Billion day in Amazon, how much products are sold at that particular time? How many of you don't know this? Because that's up to you. But your business really wants it, your customer really wants it. All the devices are very synchronously running because of this. How many of you seen certain website getting crashed and how many of you seen certain website going here and there? It's because the website, the typeface is chosen very poorly. That is why you need to check whether it's optimized for web and mobile or not. You can go to the Google Fonts, it's a free material. You can go to something called font joy. FontJoy. FontJoy is a beautiful AI tool. Okay? I took a very detailed case study in our YouTube. You can go and watch it out. Okay? It's a very, very superb session. What I loved enjoying it. Font Joy, you can able to pair fonts. You can find out Google Font and fontjoy both can able to use to create more meaningful interactions and typeface for the people. Okay, so this is the second part of it. The first part is analysis. The second part is making a sense out of it. If you guys understand these two facts, you guys are set for this day. How many of you don't understand what I Said now in this last 20 minutes, type endu. I'll explain you. No problem. Type Nu. Okay, I thought you will teach me some something to design thinking methodology. We can learn design thinking methodology. Guys, this is even more important than this. If your numbers are right, if your story is right, you can even tweak the design thinking process in a far more different way. Okay. Yes. I did not understand two font concept. Okay, fine. Ramra, they'll explain you see, there is something called font joy. Okay, now the topic is not font, but I'll quickly explain you. You can able to choose typeface for your audience to customize the experience. Google font can give you data which country people are using what amount of font for a longer time. And you can choose the typeface. That's one aspect. FontJoy is actually a AI tool which will help you to pair it. That means if you choose a heading, a different font text, a different font call to action, a different font, it will be very ugly. If you look at the screen, how many of you don't know this? Maybe you can use the same font. But sometimes numbers will not very look good in like let's say Futura. Futura numbers is really bad. If you take Helvetica, numbers is good. Text is also good. So you have to know. Okay, for heading, let me use Futura. For numbers, can I use Helvetica? This is called font padding. Like let's say in one paragraph or one set of information or one portfolio or one screen or one website. Whatever you're making, you need to know how to fare the font manually. People used to do it before, but now there is a tool called FontJoy. Can somebody type out in the Kumar. Or somebody can just take that login screen and put that. For fontjoy.com, i'm just putting the type name, but yes, yes, thank you. You can create a free account. It's a free tool. You can just put your two. Let's say what's your interest? It automatically AI does the job. It will pair the font and it will show you these two fonts works good. You can have a three combination also. Okay. It will itself select the best possible font. You just have to copy that, paste it. If you don't have the font, install it from the Google font and try using it. That's it. Many industries has this premium version also. Excellent, Kumar, thank you so much. You can try to create a free account, guys. Okay, maybe we'll go for another session detail, but not today. Okay, good. Let's come back to the numbers. So now people were able to read lot more information from this data. How many of you know heat maps? Okay, let me. Let me not talk about this. I wanted you guys to go back to your notepad and write. What are you inferring from the screen? Jagdish? There is nothing here. Here. How should I read? Guys, go and read it. There is something information available here. Go and read it. One minute time. Go ahead. Go ahead. Really fast. Sir, can you please repeat it? I just wanted you to understand inside. Take the insight from the screen. Whatever I'm telling you. Kumar. Simple. If you're not able to do it, no problem. Because I wanted you guys to get confused. That's the reason I showed you. Some people would be able to get a inference. That's okay. No problem. User focus points. Ram Raj is saying something. Okay, that's great, Ramraj. First three columns. As most click out on the three columns. That's great. Okay. Okay. What about others? What about others? Where users are engaged more. That's great. Tamil Chalman. Okay, without any further delay, let me explain guys. Okay. See this is called heat maps. This is a way to track the data. I'm talking about tracking data. But if I'm not telling you the tools, you will not be able to get it. Okay. Google Analytics is a free tool, guys. You can try it. But there is also a paid version for it. I would recommend don't learn these tools right now. Go to the industry and start using the tools which your industry uses. Being a student, it is good to understand the basics. That's far more enough. And also same for the heat maps. Just try to understand. Let's say if the red color is there, people click a lot there. You may be building a website. You may be thinking it's a fancy. But if you go and look at the heat map, there is a tool called hotjar. Okay. You can create a free account. You can just put your website and applications and whatever and heatmap hotjar will tell you where your users are clicking most. And then you can able to get the data like this. Then slowly after you get this data, you can build the graphics around it. Okay. Here people are clicking lot. Let me put the call to action button here. Buy now, apply now. Okay. See this is a psychological data you're getting from the user and then you're using it to improve your business. This is called user sentimental behavior analysis. You are trying to understand the behavior of the user and the psychology of the user by just reading it. Lot of people are Little bit typing. Yes. Here. So I can put my best product here. I can put my second least product here. I can put my basic product here. See, very simple. Red means heat, yellow means okay. Blue means cold. Nobody is even touching that. Okay. Here. So think about it. This is how designers really make a big sense out of it. There is a tool called Mixpanel. There is a tool called uxcam Amplitude. There are a lot more tools guys you can able to understand far more easier. But let me now go to the online and then I'll help you with some information, guys. Okay, Just watch out. Fine. So there is a tool called Hard Jar. Fine. Were you able to look at the sentences just watch out. So there are many examples which you guys have created. Hard Jar is a free tool and also paid version is there. But don't subscribe to all these things. Just watch what's happening. This is a tool where heat maps can be generated. Like let's say if I go to the funnel example I'm giving you. Okay, like let's say we use funnel recordings. Heatmaps. Okay, let's go to this Heat maps. Okay, so try Heatmaps on demo site. What you can do is if you really wanted to test your demo sites like say Jagdish, I built my website Jagdish. Okay, Take out that website. Just create a tag. There'll be an option called tag here. Okay. If you click that tag, I'm just showing you a demo but you guys can do it on real time. Okay, Tag that demo in your, tag that Hot jar link in your website and each of the portfolios, whatever you have as a website or everything, what recruiters are viewing it, you can able to view it here. How many of you are getting mind blown? This is a simple tool, guys. You can able to do it just right in front of you. It's a very simple tool. Okay, Just put your URL, get your thing started and once you install the tag you will get the data like this. Can you see here all the recruiters are going and signing up here. All the recruiters are clicking your product. If you can see. Oh, I have created a beautiful visual here, but nobody's clicking here now. You can now shift your visuals here. This is how you can able to start collecting some information here. A lot of people are clicking because it's a call to action. One click happened. So Hard Jar will analyze the clicks. Hardjar will tell you this. Much of people are going and clicking it here. You can also view the recordings. How much people have Clicked it here. Okay? So this is a very, very simple tool, guys. Okay? You can able to get some data around it and you can find lot of information like this, okay? Here. A lot of people are clicking here and a lot of people are also clicking here. This is two clicks have happened. This one click has happened. There are multiple ways you can able to interpret this, okay? And there are many methods to do it. Like let's say you can mark the conversions, you can mark some clicks through rates. You can also mark lot of metrics for your data. Okay? But what I'm suggesting you is don't learn these things very, very prematurely. Just get the gist of it. Because lot of people are doing research. Lot of people are what you call making a sense out of their research and they are using their metrics and other things. But I would highly, highly suggest you guys please go and interact with all these tools. Hard Jar, Google Analytics. These are all like very, very simple tools, okay? But other tools I would recommend just keep for yourself, don't try to prematurely use it. Okay, so now your technique as a designer is to build actionable insight for it. You guys are reading the data. 20% conversions are happening in your website. Like let's say imagine if you send to 100 recruiters, 100 recruiters have opened your portfolio. 90% of the recruiters are going and checking only your project. That means rest of the data, they don't care. Or maybe it could be other way around. More than 50% of the hrs are only looking at your contact details. That means they wanted to know first who you are, what's your experience. People are only knowing what's your experience, what's your experience. That means your targeting of the HRS is wrong. You're just targeting for some experience job. You're not looking for some fresher job. So you can infer a lot of information from your portfolio. I'm just saying. Okay, or maybe if you're building a product, you can also send to your user and just coming to know how much people are clicking it here. And also hotjar analyzes what age category people are clicking it here. Like let's say all the age old people are clicking this information, all the youngsters are clicking here. You can understand, okay, if youngsters are clicking here, what is making them to click here? How many people are clicking here? How can I improve that experience and how can I build a product or service around it? Or how can I bridge the gap? Or you can be other side around why people are not clicking here in Spite of creating a call to action. Why the hell people are not clicking here? What the hell is happening? Because the visibility is really bad. You have not chosen the proper colors. The interaction is very poor. Or maybe your what you call the communication is not clear. Your story is wrong. Or maybe your targeting is wrong. Something has gone wrong. Go back to your drawing board. Think. Sit with your design team. Ask a feedback from your marketing. Pretty much these things will be given by your marketing team. Guys. Okay. But you guys have to understand how to read this data. You need to go back and question them. They will not go very deep into it. They'll tell you 50% of the people want this product. Launch the product next month. This is how your design manager will also get the data. You will also be given input like that. It's your responsibility to run backward and think about. Okay, what is this 50% made up of? Youngsters, age old, 40 age working, professional, college people. Out of this 50 percentage, what is the age category of these people? What is the city they belong to? How much people engage in our website? Can I take the hard jar tool and analyze my earlier website? Do it. Your company will not do. You have to do it. Lot of designers don't even know there is a tool existing like this. Professional marketers and statistics people know this information. But you guys can make a creative sense out of it. Please understand this. And also you can make lot of what you call actionable dashboards. You can create raw data into insights. It's a total, total decision what you guys wanted to make. See, I would take Dropbox as a very good example. The reason Dropbox has really improved their product for over 500 million users. How many of you don't know Dropbox? Dropbox is a very good tool which is there for storing your information. Same like Google Drive. They handle a lot of information by just iterating again and again. And they created seamless user experience for individual as well as large enterprises. What they did. You know what? There is a very detailed case study available. Guys. Okay. I'll just paste you that link in the chat box. You guys can go and watch that case study. It's a one hour case study. Please go and watch it out. Not today, maybe later. Okay. The point here is they are a SaaS based industry. They are service providers. But they also individually provide products. They analyze the user data again and again and again. They understood what region people are engaging in the Dropbox content. How much GBS of data people are putting into information. How can I improve this? How can I do it. So a lot of people ask the question again and again and again and what happened is Dropbox has invented a solid product. Even some of the big data industries are not yet making it. And there is a very big case study also available. Please go and read it and I'll share you the link. They've understood how much we can able to automate it, how much we can able to centralize the data and how much we can able to create a self service for it. And Dropbox case study is one of the prominent case study I would say. And they also leverage the metrics like let's say push intelligence. You can see, let's say they deliver the insight proactively reducing the reliance on the user searches, anomaly detection. And they will understand something anomaly is happening and before that and how to avoid that if data is all crashing at this particular night, if lot of people are pushing the data, how can I avoid that? Maybe I can put a limiter, I can put a stopper. You can only upload 5mb today. See, see the designer who is designing the Dropbox knows all these things. You guys may be going into Dropbox or some other company, but you will have to understand it creatively, visually or you will not be able to stand out. Guys, okay? And you can drive a personalized inside. You can have a collaborative platform. The whole point what I'm trying to make is it's not about the detailed case study. It's about understand the scale and complexity what your company is dealing with. Try to automate and create a self service for the product and users. And also take a proactive steps and create a personalized user experience. This is what is the outcome. I would say being a designer you need to understand this. Okay, fine guys, are you getting it or not? Now let me show you another example. Okay, let me show you another example. Look at this. This is our dashboard. How many of you can see the screen now? This is our design for change dashboard. Okay, Like I am tracking it for the students. You can track it for anything. Guys, just listen carefully. See we have, we as a coaches and creators have told our partners to create this kind of a metrics. Initially they have come up with the metrics. But if you can see our learning management portal one year before and now it was way more different. You can see this much of people are visiting our website and this much people are converting. That means 11% of the people are coming and converting and making a purchase in our programs or maybe website or products or anything. Okay? Market average is 1%. Guys conversion ratio is really high. You can take that. You can just take ratio between the number of users who access a checkout page and sales made in the selected period. Any average 1% is a very good successful business. But we are having a far more different. And you can go to the users like let's say see checkout page means what happened in this months. You can see that this is a creative visualization of the data. You can see this users new user sign up as 72 average diu means this is one metrics which we have made it guys daily active users close to 26 people are engaging every single day. Even if one people skip it, this data will not be tracked. So I need to understand okay what I did on this particular day. Why students have engaged a lot. I'll create more content for it. Or maybe I'll create a more See while I'm moving my mouse. Can you see some line coming? Can you see some numbers coming? Designers have really understood while building this application creator while putting courses he needs this information. This is what is called inference. And you build a dashboard around it. You build the graphs around it. You build the information around it. Don't worry about how it will work. Backend and coding team will take care of it. We are not coders. Please understand that. Okay, like say broadcast. I've created seven email broadcast and people are now opening it. This much you can see 400 emails has been sent. 78 people opened. That is a very good conversion. In fact, email conversion rate is only 2 to 3% in the market general. But our emails are read by a lot of people. This is a good information open by 31%. This is close to 30% open rate. This is one information. See each and every information. We can able to take it from our dashboard page views. Very important thing courses. I told you, right? We have a course completion rate of 42 percentage. That means our course is doing extraordinarily good because people are learning from the courses. People are attending the hackathon and we are able to create a good impact for the student. So this is the point guys. Okay, so you can see this means there are students who are just impulsively learning and opening. But over the time people are not reading it. And you can see 30 to 40% of the people are reading this much of 20 students have did. But there are some students who complete 100 percentage also. So what I can say is there are two categories of students. One, they're just starting it impulsively, but they're Just taking a gap. I don't know for what reason they're taking a gap, but certain students are completing this 100% and 100 percentage completion people are not in our program. That means I can say there is a connectivity between each of the courses. And that is true. If you watch all of our courses, you will see the connectivity happening. Okay. And certain people for some reason, or maybe they're procrastinating or something, or maybe if the courses may be little dry, I need to go and look at that insight. Okay. How can I make it even more gamified? How many of you know we have a platform called LevelUp but that we are still in the building phase? We did one phase of activities in the last month and a lot of people have also engaged in it. How many of you don't know this? Like, let's say we had a lot of fun and surprise also in the last Level Up. And you can see active Level up users are 78. And you can see this much people have completed the task, this much people have completed the quiz. And Faisal has won the last. Because I want to create a gaming experience for our student. Also because if anybody joins A Design for Change, they have to track their points. They should know how much habits they have completed. There is a habit here if you don't. If you are not sure about Jagdish, I don't know how to follow a habit. I'm getting lost. You guys can come and participate in this. Like let's say daily documenting one idea, gold writing. See, this much people have completed it. Rest of the people are sleeping. This is the inference I can get right here. This is reality. I can't lie. So I need real time data with my dashboard to understand how students are learning. See, I'm just taking my case today as an example, as a Design for change. But you guys will know once you're working in a company. This is how you need to make a sense out of it. Okay, so now I have to teach students what is the habits. You will not believe. On the last Saturday and Sunday I talked about habits after reading this information. Because a lot of people are completing the courses, but they're not coming into the habit. See guys, you can't change anything in your life if you don't change your habits. That is why we as a coaches, not only me, many coaches have fought with this platform. Okay? Tagmango is our partners. They have helped us build this. Okay? We have fought this and we had a Level up council and we built a Product like this. It took us a lot of time to build this. This is not a joke. We spent a lot of money to invest and get this kind of a tools. Because I know if students are not following a habit, they won't be able to completing a course. And how many of you don't know that? We have something called a quiz. Okay, I've hidden a lot of quizzes but you guys will not know it. So you can look at this. Okay, you can, you can look at this quiz. You guys can able to complete it and a lot of people will know achievement. We have a lot of levels of achievement. You can say like let's say in the last hackathon we had like let's say the first mission was automation, system, thinker, portfolio making. So each of the course will have certain methods to track it. Like let's say people have to upload their behance profile. People have to take a screenshot of their process. They need to show the field photo because we need some proof for assignment submission. So these are all the way I can able to track the students, how they're able to work on it. So every business, every system, everything is trackable. Guys. Okay. I'm just showing you an example of our program. But each and every business is trackable. You need to understand this because nothing runs in the air. If you are thinking design is all about making fancy screens, you guys are not going to go so far. Rest in peace. All the best. If you guys can able to understand this information what I just told you, you will start making lot of sense in your design. Let's now shift this entire focus into your portfolio. How many of you had at least two to three projects in your portfolio? Type out in the chat, type out your numbers, how much projects you have in your portfolio. Maybe you have not documented it. That's okay. Just type out your numbers. If you're 0, type 0. If you're 1, type 1. If you're 2, type 2. I. I mean I know a lot of people having at least 3, 4 projects also type out honestly. Okay. Ram Raj, you're yet to put it right. Ram Raj, type out that number. That's. That's okay. Okay. Tamil Chalvan 3. Santi Lal 4. Jayanandini 4. K. Chalvan 1. Adil Murgat, 8 projects. That's crazier. Okay, who else? Who else Type the number. Arvind 4, Purva 1. Surender 6. That's great. That's great. So guys, I'm telling you one thing very simply. Take your six projects or four projects, whatever you have, okay? And try to back work the project what you created. It may be a fantasy project, it may be a real project, I don't mind. But try to make the real time data for it. Like let's say you must have redesigned some shopping website. That's what people do, right? They call themselves as a UI UX designer. Jack this I completed a course. Let me redesign Flipkart. Let me redesign this wiggy app. Please come out of this guys, okay? There are a lot of problems available apart from this, okay? You guys must have taken some real problems or not. That's okay. But take your projects and try to make a sense out of the data what you have. You can take a screenshot from the Google also no problem. But I needed you to make a sense out of this. Or you collect the data and try to make a sense out of it. And you try to find out a small solution for this out of the insight what you had. Like let's say I told you a solution of this Valentine's Day, right? We can put an offer and we can sell our products and we can get the conversions a lot. That is a business perspective. But on a user side you can also think about it. Like a lot of people have said road accident, okay? So like let's say how can I avoid this road accident? Okay, how can I avoid this road accident? This much people are getting into the problem of road accident. Road accident, road accident. But how can I avoid it? How can I prevent it? I can able to send an email for the transportation team in the India. Like let's say you can send it to nhai. They receive a lot of queries. Guys, how many of you don't know this? National Highway Authority of India nhai. There is a state authorities also available. And there are local bodies also available. There is Panchayat union available. You guys can find out this email. You guys can find out some query information or person to contact and collect some information for this road accident. And try to bring a small solution and try to get the data first, get the statistics, get the data, take a screenshot and then solve a small problem and send a proposal to them. Can you guys try it out? Or maybe your project is something else. I mean majorly I would vote. If you don't have any project, you can take the project. You guys have what typed in the chat box which you did in the first activities. If you guys already have 5, 6 project, 3, 4 project Baba, please go and take that first. You already have something in your hand. Okay. Try to first make a sense out of what you already have. Don't try to invent new every every single time. Okay. Like let's say what is your project like let's say Arun Murgant can you tell one example project which you feel sakish? I would like to mitigate this project like this. I feel there is a lot of impact in this. Can you tell any project? Arun Murugan Lending ledger Hotel Chatbot Purva is Singh. That's great guys. So now like let's say Hotel Chatbot. What does that product do? Purva can you just give me a small glimpse of it? You can open the mic and talk. You can quickly get it. Can you just quickly tell what the product will do for the user? Hello. Ah yeah Purva we can hear you. So that project is like about that project analyze the customers and it analyze the data like how customer is interacting with the hotel staff, what they are providing and the it also provides insights about like when the customer reach to the hotel how the staff is interacting.
More from Jagadeesh



Comment “ME” if you want to join the next upcoming hackathon — we’ll send you the registration link.

Comment “ME” if you want to join the next upcoming hackathon — we’ll send you the registration link.