This System Could Save You Millions of Dollars In The Next Few Years
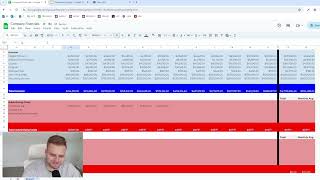
Matthew Larson walks through building a financial spreadsheet that lets you see your net margin in seconds. He shows how to set up monthly columns, list income and expenses, use formulas to calculate totals, and format it for clarity. Monthly updates to this sheet can help you spot where money goes and improve profitability.
Chapters
In this video, I'm going to create a company financial spreadsheet in real time. If you never watched one of my videos before, my name is Matthew Larson and I am the founder of 1000X Leads. This is very, very important stuff and I deal with about 190 clients inside a thousand X leads on a weekly basis. And it never ceases to amaze me when I ask, what is your net margin? And people say they think it's about. What do you mean you think and what do you mean about it should be a number that you know and that you can pull up and access within five seconds. That's the reality of the matter. Most of the time you make way less than you think. Most of the time you spend way, way, way, way more than you think. You're never going to know for sure without tracking. What gets measured, gets managed, and what gets measured can be improved. This is like one of the top five most important things to do for your business in terms of a system. And if you don't do this already, just do what I do in the video and get started asap. So I'm going to create a spreadsheet OR framework for 2024 from scratch, from absolute zero. So you have no excuses like, oh my God, I don't have anything to do. You know, I'm doing this from scratch. I'm not going to be using a template here. I'm going to enter in some example revenues, some example expenses, and then we're going to check the profit and loss. So let's get started. So I'm going to do company financials. So what I'd want to do here is just probably put my business name up here, put a thousand X leads, something of that nature. Probably what I would do as well is turn off the grid lines because you don't really need them. I'm going to do a black here, something like this. I'm going to make this bigger. There we go. Something like this. The next thing I'd want to do probably, and I don't really need all of these columns, so let's just delete some of the spreadsheet. So what would I do? Probably I don't need more than like row R, for example. So what I'd want to do here is probably put something like the months. So maybe I might do a different color background slightly. And what would I do? Probably something about January, February, March, April, May, June, July, August, September, October, November, December. And then I do something like total and monthly average, something of this nature. So this Will be my. And I'm going to change it to Montserrat because that's my favorite fun. I might do something like have another column here and do something like. What would I do? I'm going to make this a different color, actually. I'm going to make this like blue or something. Why don't we just make it green? And then I'll make the total here. And then I'm going to. Oops. Then I'll have like, this is a gap type thing. There we go. So that looks good. We'll have it like a gap like this. So what I would do now. And that green's pretty obnoxious, to be honest. I don't really like that. So what I would do now is I'm going to have my income right here and I'm gonna have basically, like my expenses broken down into different things. Like late, like ad spend, like labor, like software, you know, payment processing fees, that kind of stuff. So the first thing I would want to do is do like something like income. And here is where I would probably change the color a little bit. So maybe we'll go to like some kind of blue here. Then we're going to have a gap and do something like. We're going to do something like costs, expenses. And then we're going to start with advertising costs. And then we're going to go to something of, you know, labor costs. Then we're going to go to something like software costs. We're going to have something like payment processor costs or something like this and probably do away with this right now. But we're going to get a total at the bottom anyway. So here, like, we'd have something like. We could maybe put it to a different color or something where we have. Oops, let's try to double this thing here. Let's try to make this darker, you know, total income or something. Make that a white background. And then we want to have, you know, total income for January, February, March, April, May. And then in total over here, let's make this whole thing black. Total here. Like we would basically. So we have D10 or some D10 to O10. So if we had like 5,000 here, 10,000 here, it's going to show up over here. Then it's also going to give us an average. So we're going to go average. D10 to O10, something like that. I think I screwed that up a little bit. Average. How do you do an average one? Is the. I think you have to type the whole thing out, actually. Yeah, that Makes more sense. So let's say we have. We're just going to put some random numbers in here. So you see on the very right, it's going to go the total revenue, and it's going to do us like a monthly average as well. Don't think it's kind of hard to see what that average is, but that's okay. And then we're going to do. We're going to go to format and we're going to do dollars or currency, I guess you could say. So if we just do. Let's do some more realistic numbers like 10,000, 5,000, 7,500, 6,000. Not 6, 6,000, 3,000, 10,000, 5,000. So you can see the total and then the monthly average. And that's just a nicer way to do it, I guess you could say. So what we want to do here is right at the bottom because we might have different advertising costs, right? We might have Google, we might have Facebook, we might have, you know, whatever. So we want to have a total for each of the columns, but we also want to have a total for, you know, expenses in general. So let's make these. This one bright red. Just, you know, why not? Just to signify the difference. And then what we'll do is, you know, total advertising costs. Oops, Total labor cost, because you have contractors, you have all of that kind of stuff. Total payment processor cost. I'm going to put total misc. Costs instead, because I think that would be a bit better. So what we're going to do here is kind of the same thing. We're going to make that white text. Oops. Not like that. Definitely, definitely not like that. We just want to make it look relatively decent because we're going to have to. Oh, my gosh. We're going to have to be looking at this, right? So we're going to do this. So sum D16 to O16. Average D16 to. Oh, 16. And then we want to just do it like that so we get the average. And then at the very bottom, we could have something like total costs. Total costs. We'll make that a different color again, but total costs. And then we're going to go. We'll make that like burgundy or something. And then we'll. Here we're gonna go something like a green. And we're gonna go like total margin. We're gonna go something like that. So let's keep doing that. We'll do that part after. But what we want to do here, so we'll have like, you know, our Digital product will have affiliate commissions. We'll have our course, we'll have our program keep going, keep going like this. We'll have our referral fees, we'll have our one time offer, we'll have our recurring service like something like this where we have all of our income streams like that. The next one we're gonna have is Facebook ads, Google Ads. Let's just go newsletter sponsorships because and when I'm doing this like I'm just putting in some stuff just for the sake of showing you what to do. Like you would tailor this to your own so labor costs, employees, contractors and depends on the size of your business, you might like narrow it down to you know, contractors is pretty broad but appointment setter commissions, sales commissions, all of that kind of stuff. Software costs. I'm just going to put in some example ones that we use so close.com CRM instantly convertkit kajabi school keep going to go down some more. And like when you have, if you have something like the difference between missed costs and like software costs really like if you know you have a software that you just use every single month, it belongs in software costs. But if you do something like one off, you know, you could put it in missed costs like that kind of thing. Like that's how I think of it. At least Apollo IO. We'll think of some other stuff after. So, so what we want to do here, we want to bold it, make it look easy to read. So what we want to do here, so let's just put in some numbers because in some ways I'm going to put something like this. You can actually make these spreadsheets look really good if you take some time just doing this live from basically scratch. But so let's go. Oops, there we go. This is good for now. So what we want to do here is we want to go like we want to go some D. What would that be? D6 to D12 and then we basically. Try to. Let's see if that will work. E6 to E12 that'll work just fine. So I'm going to put in some dummy numbers let's say. So let's just put in some 2500 and I'm going to put, going to make sure to do this. Well it doesn't really matter because you'll understand but let's put in that kind of stuff. I'm just going to put in like random numbers or something. So you would go in to basically what you're doing here and you would actually do this probably at least once a month, maybe even more. But you have to do this. And that's like the important thing to understand because if you don't do this, you really have no idea what is going on in your business. And that might seem like an exaggeration to some, but it actually is not at all. So let me just. I'm actually gonna. Because I don't need. There's no need to rush this video, in my opinion. I'm going to actually do what you might do. These are all fake numbers or just example numbers, but it is what it is. Because you'll be doing this at least once a month. And then all of your stuff, all of your knowledge, like, you know at a glance what's happening in your business. It'll make your taxes easier. It'll make you actually understand how margin works and how much you're actually spending. And awareness is just part of the battle. So I'm going to just do this for now. And I'm just going to drag these just to speed it up a little bit, I guess. But this is how you would do it. You'd use the real numbers, of course. But look at. Instead of, you know. How much did you make last month? I don't know. Oh, I made 214,381 in January. It's May right now. Oh, I made 313,341 in April and I made 343,000 this month. I'm growing at 10%, basically, month over month. How much did you make on average? Well, I made 4 or. I made 4.7 mil in 2024. But, you know, on average that's 392k per month. Is this month outpacing the average or is it not? Like, very important stuff and like, don't discount it. Nothing makes me more angry when people don't do this. So let's go here. Let's just drag the entire thing basically and go. Let's just. We could press control H A and you go to number and we're going to put financial or we're going to put not financial, we're going to put currency. There we go. How much nicer is that? And what we need to do again is go sum D23 to O23 and drag it like that. Is that right? No, that's definitely not right. Stupid. Sum D18 to D22. There we go. That's better. And I'm just putting in, you know, as I said before, fake numbers. But what are you gonna do? I'M not gonna building it from scratch. I'm not gonna really put my numbers in here either for everyone to see like that. I don't care that much about what you think of my numbers. So what I'm doing here is, you know, adding it all up like that. So there we go. There we go. Look, we've done our income and we've done our advertising costs so far. So what should our. So let's keep going. Total missed costs, say bonuses. We're just gonna leave it at that for now. Like, you would actually put your own stuff in here, right? Like, hopefully that's not lost on anyone here. But it is what it is now. So let's go. Our employees get paid 50,000 per month. Like, let's just keep adding it up. Like. So let's go to sum D27 to O27. And then we got to go average D27 to O27. And let's go. Our contractors get paid 5,000, 5,500, and we're just going to keep doing this. Our appointment setters get paid 3750 to 4000, 250. 7,500, 8,000. So there we go. So let's go to this sum. And remember, we have to go sum D27 to D32, for example. And there we have our labor costs for this kind of stuff. I don't even know what this costs, but hopefully it stays at least close to the same thing as you grow. Like, for example, an email software as you grow will probably, how would you say, increase in cost. But it is what it is. All right. Some of these things might stay the same, like Kajabi and school might stay the same. I'm gonna go Trello 50, 52, 50. There we go. I'm going to just delete the excess ones here for a sec. And again, remember what we had to do before. We need to go D or sum just like that. Very nice. We can drag it like that and remember what we had to do again, we had to go sum D37 to O37. Then we had to go equals average D37 to O37. Then we can drag it down just like that. And we'll just go. I don't know what else you do for your, you know, tax. We're just not going to put any tax in here for now. We're just going to leave it at bonuses. You put whatever missed costs you can think of and there's going to be tons. But I think you get the point. Some d50 to 050 average d50 to 050. Sum. Oops. Sum d50 to d52. We'll go like that. So what we have to do now, now basically we have our income, we have all of our expenses. Now we have to add up these total costs. So what we would do is we could do it a few different ways. But what I'm going to do is going to take these totals and add them up that way. So Q23 plus Q Q33 plus Q46. And if you do this this way, make sure it's actually right because if you're not adding these up properly, then you're kind of screwed. So this formula should be here. And then we're also going to go average the same thing. So it would be average R23 plus R33, R46 plus R53. We want to make that white a little bit. So let's go to this, make that white. And then we could also add up the costs for each row as well. So let's also add up these rows. Or we'll go here, we'll go sum. What was that? D23 + D33 + D46 + D53 Total costs for that month. And let's see, does this can double check. So we highlighted it and sum here equals sum there. So we kind of did that. Right? So now we have to do. We're going to have to do D14 minus D57 to get basically our net profit type thing or that kind of stuff. Change this to white text. And then we'll go D. What was that? D14 minus or sorry, Q14 minus Q57. And then we'll go R14 minus R57. So there we have it, we have our total income and we could also. We could make it so we have this at the bottom too again, but it's fine. So we have basically our total costs, our total margin, our total income, we have our total income, we have our total costs, and then we have our total margin. So what we'd want to do here is we'll make this to get a percentage. And these numbers probably wouldn't be accurate to be honest, because I just winged it. And this is going to be a huge profit margin, total margin as a percentage. So what we would do is we would do D60 divided by D14. But this would have to be as a percentage because it's a percent, I guess. So 67% margin there, like that's probably unrealistic, but it is what it is so Q60 divided by Q14 and then QR60 divided by Q14. Oops. R14. Sorry. So this is what we do. Like, obviously I didn't put enough expenses in because 67% is not going to be a common profit margin for a lot of people. But this is exactly what you would do. You'd have a spreadsheet like this. This is 2024, you could duplicate it. This one becomes 2023, duplicate it again. And it's a good idea to back do this if you can take a Sunday afternoon or something. You have all of your numbers so that when I ask you what is your margin or how much money are you spending, you actually have an answer instead of making me angry. Not that most people probably care, but look at how fast I did that. It doesn't take a lot. You can make it a lot nicer than that too if you really wanted to. But this is exactly what you'd be doing. You take all of the money you spend each month, classify it into some of these places, you take all the income you make each month, you put it in some of these places and you get your realistic profit margin. This is not realistic. You get. You get your total net profit, net expenses, net income, and you're basically good to go. And it's. This took me less than 30 minutes here. Of course, you'd have to spend 30 minutes building this and then however long researching it. But it's not going to take more than a few hours and you'll be a lot more confident. You'll be able to grow your business properly and scale properly because you have a handle on your expenses. And that's all there is to it. So I hope this video was helpful and I'll see you in the next one.
More from Matthew







Everything I Would Change About This Ecom Email Marketing Agency (3 HOUR LIVE AUDIT)

Everything I Would Change About This Meta Ads Training Business (3 HOUR LIVE AUDIT)