Free Inventory Management Tool for Square Sellers
SalesVu's inventory tool for Square sellers tracks stock by location, automates purchase orders, and shows what's selling where. The AI assistant recommends reorders based on your sales trends and flags cost-saving opportunities across all your revenue centers.
Questions this video answers
FIFO (first-in, first-out).
In this video I will be walking.
You through the square and sales view integration specifically for inventory management.
This is a square marketplace that is.
Especially designed to help square sellers to manage their inventory, vendors and purchase orders. Now I'm going to walk you first through manage inventory. And this is a screen that shows all the products that you have on your inventory into each location. Here we're on the cafeteria, but if I go into the the gift shop or the restaurant it will show a different product list. Then we see the on hand quantity, we see the unit. So we see there's different units assigned to each different product. You can be very specific into those units that are, you know that the inventory should be counted like cheese slices. Then we have the threshold level which are notifications that are automatically sent to your email whenever you reach that level. So you're reminded to make new purchase orders. We have the deduct inventory quantity, the last cost price, the final retail price. Then we have the purchasing unit of measure which can be very different from the one that the inventory is being deducted, especially if you're doing recipes.
Then we have the quantity to order.
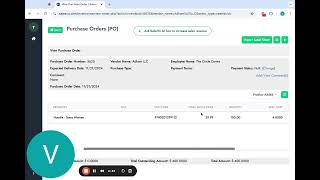
So this is a feature that we have here. So for example, we have the vendor and then we can also see a unit cost for the new PO that's assigned or maybe it's not assigned yet. So in this example we have here for the bacon, right? We're low on stock, so we can simply add here a new quantity to order. We have the vendor and we have the unit, the unit cost. So directly from here we can create that PO and place it as open or as draft, right? And then here we have the inventory cycle that is calculated automatically. Now there is another feature here that talking about purchase orders. It's also very useful which is called purchase order automation. Basically here is setting up rules to how you want your purchase orders to be created automatically for you. So first of all is enabling this if you want this to be consolidated for all the locations, if it's going to be daily or weekly. And you can set up the time of the day of your preference and if you want it to be based on the storage capacity of products or the max days on hand of the product product. So that's according to the inventory cycle. If there's a manager, right, that can only do this and then if you want to attach a PDF version of the pos. So these are things and rules that you can have enabled for each location and then once those purchase orders are created automatically for you and the purchase orders that you create directly from here, from the quantity to order. You can see that from the purchase order section. From here you can also create new PoS and do another process, very similar, but just adding more details to it. But basically it's just seeing all the information right of, of your, of your orders, for example, draft orders. So we were talking about the purchase order automation. So all of those orders are saved in here under draft orders. And if they are approved, you can simply place the order, right, and leave them as open. So that's kind of like how you can manage these draft orders, not only from the purchase order automation, but also if someone wants to leave some purchase order there and then the manager wants to review them before they're approved or do a last inventory account before they are approved to make any changes or edit it. That can be done. Now if we go into, for example, received orders, we see all the historic data of all the orders that have been received throughout the year, for example, or throughout the month. You can select the date range I just have here year to date to gather more data for demo purposes. And then for example, under open orders, we have here different payment statuses, right? So you can keep track of the orders that are paid or unpaid. Right. And simply just kind of like have that into your purchase order report. Now there's different things that you can do on open orders. For example, if I go here, we can clone it if you want the same purchase order. Once again, there's nothing really much to edit. Maybe just a few details that will save you some time. You can receive it, you can edit it, or you can view it. Now when you view this order, you can add more comments. You can change the payment status. If it has been paid, you can do a few things like receive or partially receive. So here let's say you received the order. Instead of 100 products, you actually got 80. You can add the vendor invoice number. What will happen is that those 80 items will be automatically updated into your inventory. Then you have this line item added at the very end with the products that are missing. You have the total cost and unit and unit cost. So these are things that will be done automatically for you. Now another thing that can happen is, you know, you can edit the quantity or the cost, or you can return items to the vendor. So this is another feature that we have here. So the reason it could be maybe for example, a damaged product and submit it, right? So then in that case we have all these products, 80 products, they were returned to the vendor. Or it could be you know, maybe expired products, whatever it is, you have information in all that historic data of all the different management of the items that are received with all their changes. Now we have here also the budget utilization. So here you can create.
Or set.
A category budget for different, for example, categories, the bagels, bakery and bread, the bar. And you can do this monthly or quarterly, right? So then when you are managing your purchase orders, you can actually see this breakdown and see how much it has been utilized during the month, how much has has been spent according to the budget that you have for each one of your categories. Just to kind of like make it easy for you to know whenever you're creating those purchase orders, if you're going over the limit or if you still have some budget left to cover. Kind of like those items that are needed for, you know, throughout the month.
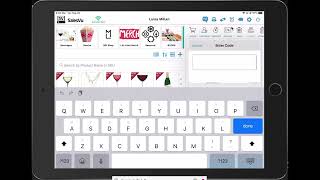
For example, now in the Square POS.
App you can take orders like normally.
So you can add here a customer.
Very quickly and simply add the product, right? So here we're going to add a.
Bagel and simply charge it. And now for this example, we're going to use cash. Now anytime that you add any brand.
New, brand new products on your square account, they will be automatically be added into the inventory management section that we were talking about before.
But the only thing here is that.
You will need to add that initial.
Quantity on hand that you have on.
That manage inventory section place just where we were in.
And then when you sell those products.
Here, they will be deducted from your.
Inventory management and this will be by the FIFO accounting method. Now I'm going to walk you through.
The all in one report.
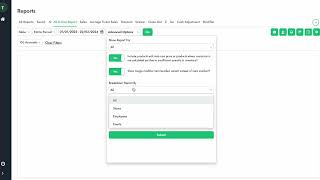
Our only one sales and profitability master report is a report that can help consolidate financial data from different date ranges. For example fiscal, year to date or a specific date range from multiple revenue centers. Here we have the information stored from all these different centers, for example, gift shops, cafeterias, online shop, restaurant, and so on. Now this is not only for the different areas, but also it's a report that can be break down by the products or even the categories as well according to the information that the organization.
Would like to gather.
Now some of the tasks that can be accomplished with this report is for example, compare across revenue centers, which one is the one that had more sales and profit during a certain period. So after we have selected the time or date range, we can have here an option to freeze here or pin the column and then sort by the net sales and the profitability as well for all of the locations. So this way we can See it and compare these actions and this results between, you know, all of the different locations. Now if we wanted to see this in a chart, we can also select the profitability information for the locations that we want to compare and see it in a bar chart. Now this is something that it will help analyze this information during a board meeting, for example, and compare this information in a more visual way. Now if there is product that is being sold on multiple locations, we can also set up this report to show all of the different products. And then what we can do is group it so we can see where is this product being sold on each location. Let's go into the cap example. So we have here the information of the sales of this specific product on the circle and east side and primary gift shop. So here we can go into the profitability information and the quantity sold so we can see the performance of this product on each one of these locations. Now last but not least, this is a report that it's very easy to access and to review because we have the automated schedule email report in which everyone can have this report on a frequent basis according to the send time, start date and the frequency that you add for everyone in your team to view it before on a specific meeting. This report can also be saved, printed, exported and you can also customize the columns to view the information you need to have. Exactly.
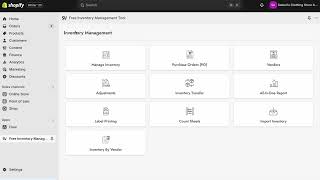
Another feature I want to talk about in this video is ask sales U AI so you can ask absolutely anything related to your inventory management, for example, how to increase sales revenue. Or in this case I want to ask what products should I reorder from my vendors in the cafeteria location based on the sales of the last month. So what the system is going to do is analyze all of that data, sales margins, costs, absolutely everything, trending, stock levels. And based on that, it's going to give me a recommendation. Now I can follow that recommendation based on, you know, based on these trends or based on this data, for example, cafe au lait, espresso shots, bagels. Then it's going to give me, you know, give some promotions, the reorder strategy offerings and things like that, right? So I can analyze this and make a more accurate decision with this data. But then again, I can ask absolutely anything. This could be, for example, how can I reduce my cost of goods based on the last quarter and things like that. So it just analyzes absolutely everything and gives me this data and these details to me and my team to increase efficiency as well for all the team. Now we see here that there is so many other sections like count sheets, stock settings, transfer inventory, and so on. And these will be other features that I will demonstrate in future videos. So I hope that this was very helpful and let us know if you have any questions.