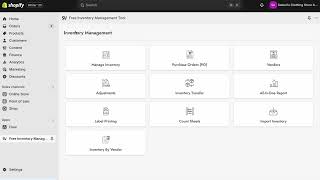
SalesVu technical support walks through the Profitability report in the inventory system. Access it via Inventory → three dots, then choose from profit margin, cost of goods sold, historical prices, or total cost of inventory. Filter by product, category, employee, or location, set date ranges, and switch between table, line, and bar charts.
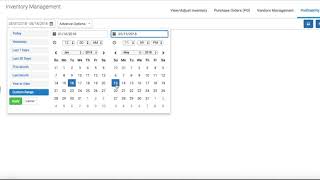
To access the profitability report, go to the Inventory section and click on the three dots in the upper right hand corner. In the Profitability report, you can run separate reports on your profit margin, your cost of goods sold, historical prices and costs of products, and the total cost of inventory. You can view your profit margin as a percentage or as a currency value. You can break this report down by products or categories. That way, you can select specific products or specific categories for which you want to view this report. You can expand the product window to get a larger view of your products and categories and also search for specific products. You can further break this report down by employees or by locations where the sales were processed. By default, you will be shown the last seven days from today, but you can change this date range to any custom range. To change this date range, you have to click anywhere on the date field. Instead of a custom range, you can use one of the quick date ranges on the left side like yesterday or last 30 days. Here we're going to do a completely custom date range. In this section we'll be selecting the start time and date, and in this section the end time and date. You can choose different visualizations for this report. You can run this as a table which we're looking at right now, or you can change this to a line or a bar chart. The line and bar chart visualizations can be used when you're also breaking this report down daily, weekly or monthly to see the evolution of your profit margin over time. Your Cost of Goods Sold report can be viewed as the average cost of goods sold till date or average price of the goods sold till date for your individual products. You can break these down by locations. Most recent metrics report will show you the last purchase order cost or the last selling price of specific products. The Total Cost of Inventory report will show you the value of products you have in your inventory. You can view your overall cost or broken down by products or by categories. If you have any questions about the profitability report, please contact us by chat, phone or email. 247 we'll be happy to help you.
 eCommerce, point-of-sale (POS), ERP and Data Analytics platform for retail and restaurant businesses