SalesVu walks through the All in One Sales and Profitability Master Report. Learn how to run it, read each section, and use two new settings: compare your numbers to last year and see vendor revenue share based on commission assignments.
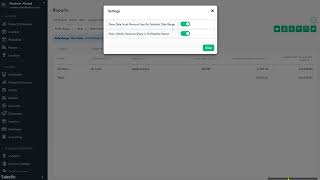
Hi, Today I'm going to introduce you all in One Sales and Profitability Master Report. So to run the report, go to the Reports tab and click on all in One Sales and Profitability Master Report here. So after clicking you will have multiple filters. So date, range, types of the report and then most importantly you have advanced options. So here, let's run the report for an example product that I prepared for the video. So let's select the product so I can use control F to find the product quickly to avoid scrolling down so you can also expand it. That will make it easier for you. So I selected the product and I'll click on submit. So I'm running this report for this month. So I will select this month and I'll click on apply. So here once you generate the report, it has multiple sections, so it will show you the location information. So all stores are selected, but this product only belongs to one location, but still showing all stores. So if I want to see specific store, I can break it down by stores or employees or even events. So here the second section of the report is product information. So it will show you the category level one. So it belongs to my fruits and the product name, its barcode, SKU and vendor information. And then you will be able to see the profitability part section of the report where it shows you the margin, net profit, percentage of the profit quantity sold for the selected date range. And then you can see the sales performance section of the report. Here it shows the sales that were made on the selected date range. So technically for this month, so sales net of refunds, discounts, net sales tax, percentage of sales, total cost, average cost, last cost, price, average retail price. And then you can see inventory information section of the report. So that will show you the start quantity and end quantity for the date range. And you can see the total asset value, total retail value, percentage of the asset value, quantity sold, previous year, quantity sold, change net sales for the previous year, net sales change, percentage of quantity sold, percentage of total cost and vendor revenue share. And it will end with margin net of revenue share. So we introduced two new improvements. So first to show data from previous year for the selected date range. So to enable this additional columns for the report, you can go to the settings at the right top and then you can enable these two fields. So the first one is show data from previous year for selected date range. So this setting will help you to enable this column. So let me show you. So quantity sold for the previous year. So as you can see it shows 3280 so where this data is coming from. So here in this report. So I selected this month which is January from. From January 1st to January 26th. So when you look at this quantity sold for the previous year, it's showing you the data for the same date range but from the last year. So from January 1, 2023 to January 26, 2023, you sold 32.80 this product. So this will make it easy for you to see the data for the previous year for the same selected date range quickly so you don't have to go and run the report for the previous year. For example, I did that on another tab, so let me click on it. So this is the same report from the another top. So it shows January 1, 2023. January 26, 2023. And this is just the quantity sold you see, as you can see, it's 32.80. So let's go back to the report. So here you can see for the previous year we see this number and then we can also see the change in percentage. So I sold less than last year. And then net sales of the previous year. So you can see the dollar amount and then the change in the percentage and percentage of quantity sold and percentage of total quantity sold. And then we also added another setting show vendor revenue share and profitability report. So with this information, so when creating vendors in Sales view, it has a setting that you can assign commission for each product. For example, let's go to the vendors on another tab. So I have a vendor here. So this is under inventory section. So I go to vendors and next to let's say this vendor, Food Inc. So we click on the arrow down icon and we click on assign commission. So here you can select the product and then once you select the product you can scroll down and set up the revenue percentage that you're going to pay out to the vendor. So I save, so once you save it saves the information and you can go back now and based on this, so once, now once you sell those products you will see a data under vendor revenue share. So this is the dollar amount based on the percentage that I set up that the vendor should get paid. And this will show the margin net of revenue share for the same based on the same information. Thank you.
 eCommerce, point-of-sale (POS), ERP and Data Analytics platform for retail and restaurant businesses