SalesVu & Clover WebPortal
A walkthrough of the SalesVu admin dashboard showing how to manage inventory, staff, sales, and marketing across multiple locations. The tutorial covers role-based views for different managers, automated reports, and tools like dynamic catalogs, PO management, and loyalty campaign segmentation.
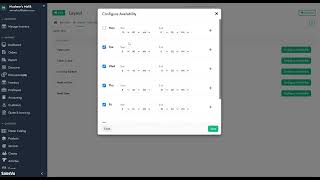
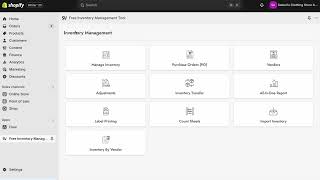
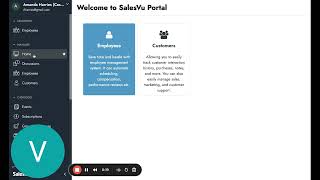
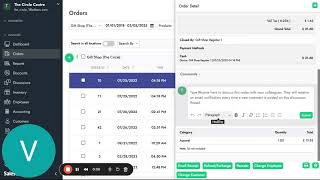
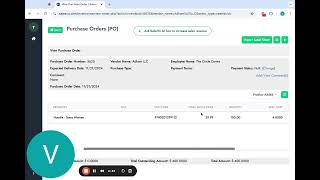
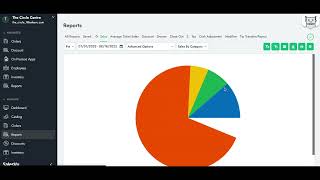
Welcome to the backend of SalesVu. Here is where you can manage multiple locations and multiple industries. SalesVU is an all in one mixed use commerce platform. Here on the left side menu you can access to all the different modules that are grouped into sections. We have Manage, Streamline Operations, Grow and Support. Under Manage we have Dashboard which is a brief summary of the transactions of the day. Then we have Catalog which has all of your products and services, orders for all of the different orders of all your customers from every single point of sale, reports, discounts, inventory. We have Employee Manage section and Accounting. Next under Streamline Operations we have Locations, Dynamic Catalogs, Online Premise Apps, QR Code, Ordering, Website Setup, Wizard, Quote and Invoicing, Web Store and Reservations. Under Grow we have Gift Cards, Loyalty, Recurring Billing, Marketing Automation, Customer Satisfaction, Worth of Mouth Marketing, Message center and Website Managers. And under Support we have Managed Subscriptions, Knowledge based Articles, Videos, Support Access, Support Tickets, Schedule, a demo and chat now with our agents live. Also we have a section for favorites which can simply be accessed by going to the Star icon next to any of the sections and that way you can access them for a quick access. If you'd like to remove any of them, you can also click on the Star and they will be added back to where they belong on each section. Now I'm going to walk you through the modules with some scenarios. As the IT manager Jack would want to check all of the multiple devices from SalesVU and also from Clover easily. Now the best way to access this information will be under On Premise Apps. Jack in here can simply use the filters to find the devices that are on an exact location. For example, for the Circle Restaurant in here Jack can see all of the different apps, the name of them for each one of the Clover Flex and then also the Clover POS and then any other apps for Sales View if there is any pos, incoming kiosk or so on. Also it's very important for Jack to see that every single one of them has been updated to the latest app version as well and also that they are synced on time just before they start taking orders or just before they're going live. Now in this information, in this report you can gather all of this information just to make sure everything is set up properly before taking orders from the customers. As the FMB manager of the restaurant, Claire who wants to make sure that all the time based menus are set up correctly before the restaurant opens, she can check that information out under the Dynamic Catalog section. Here she can check if there is any time based menus are not set up correctly, for example with the start time and the end time and also for the days. Also, if she wants to add a brunch time based menu, she can come here and add it under Dynamic Products and Service Catalogs. Now it's also very important for Claire to check that all of the different products that have specific units are deducted correctly from the inventory. She can check from the catalog directly by searching for a product and then going to the specifics of this product. Now from here she can check the price, the price override as well. She can check the category that is set up correctly, the inventory setting, and then she can go to the modifier groups. So she can have modifier groups for toppings, extra ads or cheese of choice things that may not have any extra cost and she can check that they are mandatory and they have a maximum amount to be selected. For extra cost she can go to moi fire group such as extra add ons and make sure that all of the different options have the correct extra cost for these specific modifiers. Now for the components, she wants to make sure that the units are exactly for what needs to be deducted. In this case she has the hamburger buns and the meat with the quantities to view this information. In general, for the rest of the products she can easily go to manage modifiers or she can also go to unit conversion to simply add any other units that would make sense for the specific recipe level menu that she has for the restaurant. Now, John, the inventory manager wants to see the current inventory count on the restaurant. For this, he can see this information from inventory section on the very first screen where it shows the view and adjustments for the restaurant, John only needs to select the correct location since this is a multi location multi industry account. After checking the information for each one of the products for the quantity, the unit, the threshold, the last house price and the final retail price, the inventory management can set up all the necessary POs to update the inventory according to the information that he sees in here. He can easily check what are the open orders, edit any all of any one of them to add any other products or receive them partially with any sort of information or comments. He can also check which ones are the closed orders as well and also any other draft orders. Now for this case he doesn't need to create any POS at the moment. What he wants is to transfer inventory from one location to another. But first he wants to check any adjustments on the inventory based on the negative discrepancies that he noticed. Now under here John can See the product name, the before and after quantity, and the date and the change with its corresponding unit and and note for each one of these adjustments. Now, these adjustments can be as broken bottles and expired products or missing products that will not found on the inventory count. For the inventory transfer, John can do this very simple by simply selecting the source and the destination. So this way he can do it in just one second and won't take much of his time just by simply adding the transfer quantity right here. And then the inventory on each one of the locations would be changed automatically. Now we can see easily the source available quantity and the destination available quantity. Now, in this case, we're only going to move some of them because of an event for this next location that needs to have more quantity available. From a finance perspective, Rachel wants to verify the different tax brackets that have been added into the products and she wants to make sure they have been added properly. All she needs to do is go to the tax report and from here she can see that all of their needs for the different taxes are added accordingly. So alcohol, beverage commission, sales, sales tax, any custom item tax has been added as well. The taxes can be also set up per product. So Rachel can also go into one of the products, each one of them, and see that these taxes have been added to each product accordingly. For a more specific report on how the taxes have been deducted for each one of the products on the order, she can go to the orders report and export this information as well. Now, James, as the store manager, he wants to see the sales in different ways. He has some reports saved that he can access quickly with just one click. All of these different filters help to create the reports. But what James needs is a sales comparison by each one of the POS or point of sale. He recently added a kiosk and what he wants to see and compare is in order to see the performance of this kiosk, in the case it's not getting a lot of sales, he can possibly move the kiosk to another location so he can get more traction and get more sales into this new kiosk. Right here, James can see the Kiosk 9 that has been added and and the total sales as well. It could be not the traction that he's getting that he wants to get at the moment. So again, he's going to find a new strategy to move the kiosk to another location. Now, James also wants to see a comparison between the categories. There are multiple ways to see this. It could be either by a bar chart or it could also be by a piece pie chart. Both ways are possible. So from this category pie chart, he can easily see the category that is having more traction. However, the category that is more profitable for the company right now is the visual arts. So what he could do right now is find a new strategy to start promoting these products under these categories so he can increase the sales under this specific piece. Now, Courtney, the general manager, she's supervising the sales from all of the locations. So she pulls up a report that can help her see the performance of all of them. Now, from this report, Courtney can see a pattern on all of them. She can see that the end of the summer, it's the beginning of the slow season for them. She can start creating new ways to start pulling up the sales for this slow season specifically. She can clearly see that this is a behavior that is happening on all of them, not one in specific. As an employee manager, Tucker, he wants to review the shift report for all of his employees and he wants to also see the cash management. So in order to see this, he can go to the shifts and staff section and simply click under the shift report. This gives him a quick access to close our report that gives him all the details of the shift information for each one of the locations and also by each payment device and for each employee. He can easily see the clock in and clock out for each one of the employees and then see information in detail for the shift, such as the taxes, the cash, the credit card, and all of the transactions at the end. Now, if there's any cash adjustments, he can see it from here as well. Or he can go to the cash adjustment report in which we can see that every single movement of cash has been had arisen. Typically, the responses that he normally wants to see is starting, bank, closing bank and deposit to save. But if there is any specific cash movement, he can see it from these specific report. Now he can also get the information on the hours report from here. He can see the information for specific employee in this specific hour report. He can see the clock in and clock out time. He can see if there is any hours that are missing specifically so the employee can make up for that time, or if they did any extra hours and those hours need to be paid as well. He can gather that information from this report and also from the labor report. He can easily get the information for the labor cost ratio for each one of the employees. You can even narrow down the information based on a specific location or job title and see information such as the compensation time and if there's any employees that need to have like a salary instead of hourly, he can set that up as well and see that information from here too. And at the end see the labor cost ratio for the employees that already making transactions and are active on this restaurant location. Now, for profitability reports, the cfo, James probably wants to see the performance of his most profitable items. So for this report, he can see it from the only one sales and profitability master report. James can see this report by product, products and even break it down by a specific location. Now from this report, what James wants to see is find his most profitable item and check his performance. So from here he can see that right now this product has the most profit and also a really high net margin. If he keeps scrolling, he sees that it has a very good quantity sold and he can keep checking all the items such as tax, percentage of sales. Then he can also see the total cost, average cost, and also the inventory information such as the star quantity and end quantity for these specific products. Now, if there's any information that he doesn't want to have as of now or he wants to add on this report, John can simply customize the columns and add any other sort of information that he wants to have in this report. Finally, from the total cost of inventory, John can also gather this report by different filters. Now in this case, he's going to do the exact same information for all products and for a specific location. What Johns wants to gather from this report is making sure that the total cost of inventory is not higher than the total sales. From here, he can create a sale of the items that that are not sold yet and have a higher cost of inventory as of now and he wants to start getting rid of them. This information can be feed into the marketing team. So then they can actually start creating some automating. They can start automating some marketing campaigns for the products that need to go out of the inventory as of now and talking about marketing automation, that's another and one of the last sections we're gonna go over. So Jessica from the marketing team, she can go to the marketing section and start creating the corresponding automated emails with the coupon codes and campaign for the specific sales for the products that the other team has. Let her know that need to have some sort of coupon code to be sent to the customers. Now what you can do in here is create specific emails with any sort of images or attractive information for the customers. Inside the body of the email. She can add the characters for the customer name for the discount code. For the product and category. So these variables will be replaced with the actual values for whatever the coupon code name or whatever the customer name is. So the system will do it automatically for you. And you can also add like nice images like we have here on this example. Now for the rules. The marketing team can set specific rules according to different conditions. So there are conditions based on the city, if it's for a certain group of people, based on country, state, zip code. Also it could be by purchases. So so based on amount spent, the date spent, the frequency, the products that they purchased, the categories, and then it could also be by recency, by the date or a quick pick. And finally, you can also create your own customer groups customized by any sort of information you want to group your customers with. And after you create your customer groups, you can select this option and the system will show show you the customer groups that you have created before. So you can have this more of personalized customized email campaign. This way the whole automation process doesn't take her too long. And once she sends these marketing campaigns, she can track, she can track the success of these emails by checking if they have been redeemed. Also if the email has been opened or bounced since that can also happen. So from this report she can also check if that the email that she has from the customers, that email is working well and she can keep getting in touch with them via email or SMS as well. Last but not least, Jessica will also want to review the performance of the loyalty program that is currently under allocation. Now from this report she can see the status of the loyalty program for the customers, which ones have been activated, how much has been unlocked, redeemed or the loyalty tier as well for majority of her customers.