SalesVu - Reports Training
Learn how to build and schedule reports in SalesVu to track sales, inventory, staff performance, and profitability. The tutorial covers sales views with charts, location comparisons, average ticket by employee, reorder forecasts, and cash adjustments.
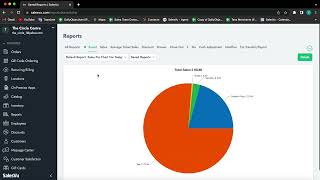
Welcome. In today's video, I will be walking you through the finance side of SalesVu. We will dig into reports and I will show you multiple examples of some safe reports that I have on this demo account. So in order to go to Reports, all I'm going to do is go to the left side menu and click on Reports. Now as soon as I open reports, the first tab that will open is All Reports. So in here you can see a dashboard of multiple reports such as sales and profitability shifts and staff inventory and vendors marketing programs and security. Now what I'm going to do here is that I'm going to give you a quick overview of each one of these tabs and I'm going to show you some of the best practices. Perfect. So the first thing I'm going to show you is here on Sales, you can program your reports using all of these dropdown menus to see the information that you would like to get. So we have multiple views such as table, pie chart, line graphs or bar. Now you can also choose the different periods of time or or you can actually utilize this drop down menu to select a custom date range for advanced options. You can show the cumulative sales for products, different category levels, and you can also break it down by the pos, by employees or by stores. So you can really search for any information in specific that you would like to get a report on. Now these reports can be saved, you can save the filters. What this means is that you can save the dropdown menus in any specific order so you can access to the same report in an easy and quick way. Once you save these reports, this will show on the saved tab. So I'm going to show you some examples in a minute. Now you can also schedule your reports. For example, you would like your employee manager to get the employee report on a daily basis or maybe on a weekly basis every Sunday or every Monday. And then you can select the start date. You can add any email addresses that you would like to in this specific section and you can also select the format. Now this person will get this specific report on the date range and the hour that you selected without doing anything else on the backend. So this will be automatically sent. You can also save these reports export in a CSV file or print these reports if you have a printer connected. Perfect. So I'm going to walk you through some of the reports I have saved. Perfect. Now that we are on the save tab we can see that there are two drop down menus. The first one is the default report. So anytime you open this tab, you can actually select which report is the one you want to see first. So in this case I have the sales pie chart for today, but you can select anything else that you have already saved. So we can do for example a comparative table and once we click on it, the table will be shown. And every time you open this tab, this will be the first report that you will be able to see. Perfect. Now the second drop down menu are the saved reports. So I'm just going to walk you through some of the reports I have saved and the benefits of these reports. So let's go first with the locations comparison so you can compare the sales by location. And the benefit of this is that you can be even more efficient at reviewing all the location information in one single report. So you can actually check what is the behavior of for example a new location you just open, see if there's any improvements that need to be made or if it's going in the right direction. Or you can compare all of your multiple locations and see if there is any behavior that is not common and then take some actions in a very quick way. Perfect. Another report that I have saved right here is the average ticket sales by employee. So this will help you compare the average by employee. You can identify the best sales employees so that they can train the rest of your staff members. And this way you can increase the business revenue so they may have new techniques that others can implement. They can train new staff members and learn the best practices so that the average ticket sales can grow for all of your employees. Now let's walk through another report that I have saved here, which is going to be the last three months sales report by threshold. Now you can set the inventory threshold according to an average sales and forecast the reordering. You can improve the cash flow management by getting notifications about when and what to buy according to the business sales. Also you can forecast what quantity to reorder taking into account the inventory on hands objective. So the overall goal of this report will be to save money. This way you can get all the different specifics of each one of the products, the store, the date, how much was discounted, and then the total sales for each one. Now let's go through another type of report which in this case is the total sales by location. So, so according to a specific date, there is a specific date in this example is September 19th. You can see the quantity of each one of the sales and then the total sales. Now at the very end if you scroll down, you can see how much you received in cash, in credit card, in gift card, check or credit card tips. Perfect. So the overall overview is that you can get the specific of any type of report that you would like to get. And then again you can also export or delete this safe report. Perfect. Under the discount tab you can see the performance of all of your different discounts that are being utilized as of now in your business. You can choose these drop down menus to first select a date range. So if you like to see how your discounts are doing in the last seven days, or even pick on a specific day as well, you can totally do that. Now under advanced options you can filter these report by payment device locations or the discount type. Right. So you can actually see very specific information. Now in this report that I have right here we can see the order id, the customer name, the discount type, the discount name, the date and the time, the discount amount, the product, the approver, and then the order amount. Right. So there are a couple of benefits from this discount. First of all, if you are creating a new marketing campaign promoting for example a new product, you would like to utilize a discount and incentivize your customers to purchase this specific product. You can see here if want you, this discount has been in fact being utilized by your customer and it has been successful your marketing campaign. Right. So in here you can see specifically that and then create any other new strategies or maybe remove it and do something else. Right. So you can keep a close eye on these specific marketing strategies. Now another very good thing that you have in here is checking who was the approver. So you can also reduce inconsistencies from employees who could apply discounts to non eligible customers. For example, they would like to get the employee discounts to customers so they they can get more tips. Right. So that's something you would like to reduce or if possible avoid. So that's something that you can totally check in here and keep a close eye on how this discounts have been utilized. And also you can increase the revenue by extending those strategies. Any discounts that you are utilizing right now that are bringing more traffic to the business and are profitable. So if this is something that is actually giving more benefits to your, to your business and to your sales, you will probably want to keep using this discount for a longer time. And then you can change the date range and have this discount for more time being available for your customers. Perfect. Now in here you can get the drawer report if this is something that utilizing the closeout report as well. So whenever the shift is closed you want to see for example the information regarding of your locations, the payment device, where was this closed out report coming from, the employee name and then all the information when did this shift started, when did it end it and all these other informations that could be very useful. And then this discount can also be exported or printed. So if you don't want do you don't have the availability to see these from the pos, you can totally check this report and we will keep the data stuck in our software for whenever you want to utilize this report. So if you'd like to check for example the closed out report from last week or last month, you can totally access this. Now the seereport is a report that has even more in detail information. You can totally again access this by any specific custom date range or you can even choose by locations. So in this example we are in the primary gift shop and now it's showing us the date and the time. So this is just giving us the the summary of all of your sales. We have here the gross sales, the total amount, any refunds. If this was anything that will be standing, it will show us here the total amount, the sales net of refunds, discounts, net sales taxes, net sales and taxes, tips and then any other payment details that were utilized during this period of time. In this case we only have gift cards, one transaction refunds and then the number of transactions. Right. So this is a report that can be very specific about all of the details of your sales. And then this report can also be scheduled, it can be exported, printed and printed. You can also have specific reports under tax. And now if we go to cash adjustment, this is something that it's very useful because it will help you see, it will help you compare the information of the system about the shift with the information that each employee enters. So a good benefit of this is identifying possible employees stealing the money from the drawer. So in here you can get the specific employee, the time, the amount, how much was before cash, after cash, and then if there is any outstanding reason for the change of the cache for this cache adjustment. Right. You can also change this by in a specific date range to see more information. Right. You can also here use these filters to check by, you know, the POS that it's being utilized and then checking anything that it's outstanding on the cash adjustment. If you utilize modifiers under your menu, you can totally see reports for the modifiers and also if this is something that you're utilizing the tip transfer and then the payout report. Now a couple of other things under reports will be inside the inventory module. So again, what I'm going to do here is simply going to the left side menu and clicking under Inventory. Perfect. Under Inventory adjustment, one of the reports that you would like to get is inventory adjustments. So the way to view this is by clicking Adjustments and then you can get the information to do the inventory count. So if there is something outstanding, something that doesn't really fit under your inventory count, you can totally check in here and review if there's any adjustments that were made by your employees. So in this case we're just going to come here and change the date range for more data. And then we can see here what was the change under the product. So for example, we have all these products, we have the date range, the before quantity, the after quantity, how much was changed, the unit, the cost, price, and then a note. For example, in this case we have one of the products that was expired, a rotten product. Or this also works very well with tracking the overpouring of liquor or maybe even broken bottles. So if you have an inventory, a purchase order for your inventory to be adjusted automatically, and when you receive this order, you check that one of the bottles was broken, you can totally make this adjustment and simply changing here the quantity that you actually receive and then save the note and explain why you didn't get the full amount that you ordered. So those are just a couple of examples that you can get in here under inventory adjustments. And the very last report I'm going to walk you through is pretty profitability. So that's where we're going to go right here. I'm just clicking under here and then in here you can do multiple things. Then again we have the different drop down menus that can help you check by profit margin, the cost of goods sold, the most recent metrics, and the total cost of inventory. You can totally change the way you view these reports by table, line or bar. So we're going to leave it by table and then you can totally check for any specific period of time or custom, the date range. And then any specifics could be also found under advanced options. So in this case I'm going to go for products and then I'm just going to go simply click on submit. Perfect. So we can see here the total cost of inventory under all of the stores. Here we can see the name of the product, the day, the total cost of inventory, and then the total quantity. So this is something that you can also print and you can also export into a CSV file. Thank you. For watching. And if you have any questions, please let us know.