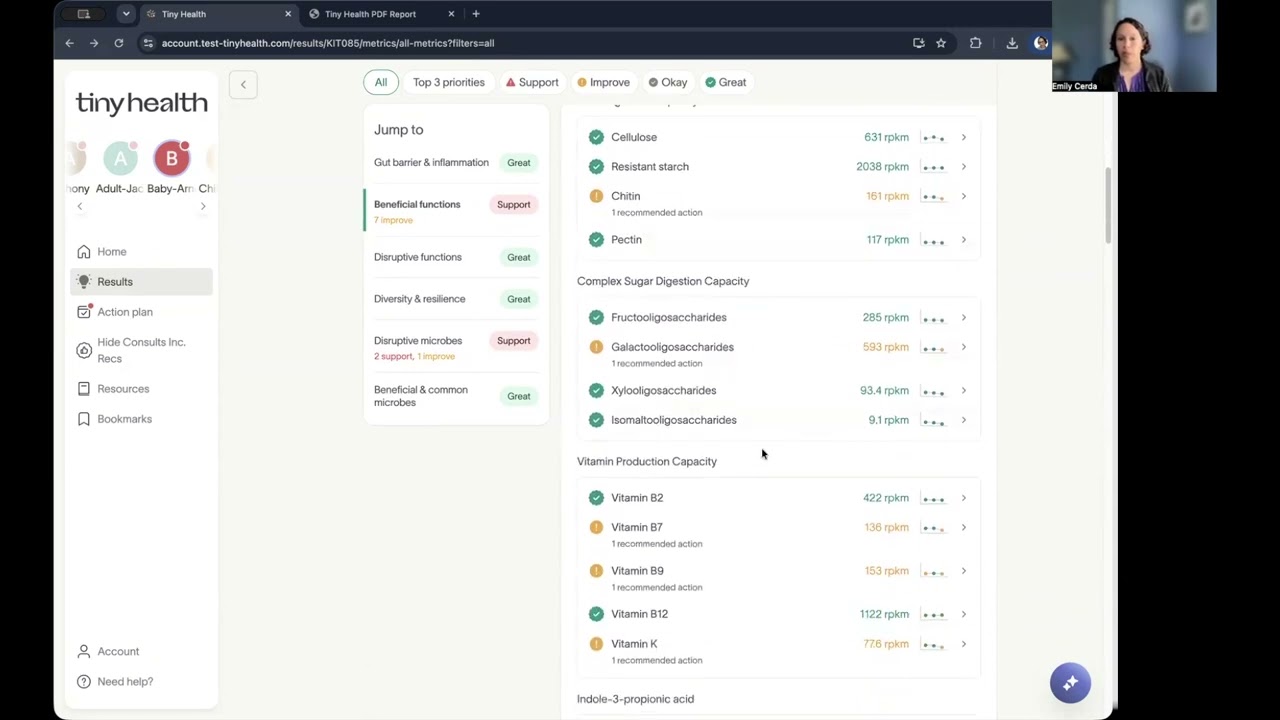
In this practitioner‑focused video, Emily Cerda, a microbiome specialist at Tiny Health, provides a systematic walkthrough of the Tiny Health Pro Gut Health Test PDF report. She explains that the Pro report contains all sections of the standard report plus additional Pro metrics. The tour proceeds page‑by‑page, covering patient identification, sample details, and the disclaimer, then moves to the microbiome summary score that compares a patient to an age‑matched population. She distinguishes the stool chemistry panel (exclusive to Pro) and describes how results are flagged as typical, borderline, or needing support. The gut type section outlines dominant microbial patterns. The results summary grid (page 6) aggregates metrics into four evaluation levels and highlights up to three top priorities with suggested actions. Detailed category sections (e.g., Pro‑Markers, Disruptive Microbes) list each metric, its description, evaluation, and reference range, and include species‑level detail for families like Enterobacteriaceae and toxin gene detection. Recommendations are presented in up to three actionable steps, framed as suggestions rather than treatment plans. Gut‑body associations link flagged metrics to body systems based on research, intended as conversation starters. The appendix provides a full microbiome breakdown, top‑20 species with descriptions, and a comprehensive species list down to 0.005% relative abundance. The metrics index (page 52) offers a quick lookup of metric numbers, names, and patient results, useful for retesting. The final sections cover how to read evaluation scales, trend bars for resampling, taxonomy hierarchy, units of measure, and guidance on resampling frequency (once or twice a year, or more often after interventions). Emily concludes by recommending a workflow: start with the overview (page 6), dive into detailed categories as needed, consult recommendations, and use the metrics index for quick reference. She directs practitioners to the Tiny Health practitioner portal and email support for interpretation assistance.
Chapters
Hi, my name's Emily Cerda. I'm a practitioner microbiome specialist here with Tiny Health, and today I'd like to take you on a quick tour of the Tiny Health Pro Gut Health Test report. This is the PDF you'll receive for each of your patients, and just so you know, if you don't run a Pro test and you run the standard gut health test, everything is the same here. You just won't have the Pro metrics. That those sections will be missing from the report. So here we're gonna— not gonna interpret our results today. Instead, I'm just gonna show you how the report is organized and help you get through it as quickly as you need to so that you can help your patients. So here, this is the COVID page. This shows the patient's name, your sample ID, and the collection date. Okay. And if we advance to page 2, you'll see that page 2 has the report details, all the patient's information, the samples, the date the sample was collected, and also the date it was received by the lab. And below that is the disclaimer. Now, on page 3, we start to go into the overview. So that's really on the next 3 pages. The first thing you'll see is the microbiome summary score. And this is a score that takes all of the shotgun metagenomic metrics into account and really looks at how that patient is doing related to others their age. So you'll see that that curve is actually a population curve for their age group. And we can see where they're sitting within the different quartiles of that population. Now, this is only the shotgun metagenomic results. It does not include the ProStool chemistry metrics on a Pro report. And so if I flip, flip the page to page 4, you will see that this stands for those stool chemistry markers. And here we're going to get either a typical, a borderline, or a needs support result for that evaluation. And this can be used as a quick flag. For whether the chemistry panel really needs a closer look. Okay, if we flip to page 5, here we have the patient's gut type. This is really the dominant microbial pattern in the patient's gut, and then you'll see the breakdown of those major groups of bacteria, and then you'll see below that a little bit about their gut type. On page 6, we have your results summary, and this is a great place to start if you're, if you're used to looking at these results, because you'll see across the top we have all of the metrics tallied into those 4 levels of evaluation, with support and improve kind of needing a little attention, and then the okay and the great categories not necessarily needing action. The middle grid really breaks all of those metrics down by category. So here you're going to see 7 different categories because we have those ProMarkers. If you run a standard test, you just will have 6 categories and that ProMarker category will not be here. So here again, you can see by category where the most support is needed, and by the category description, you can kind of see what where that support is needed and what might be going on as far as the patient goes. Now, below that, you can see up to 3 top priorities, each with a short explanation of why we see this as important. And then down below that, you will even see some of the top actions to take based on what we're seeing in the microbiome. So if I turn the page here, we start to get into each of those 7 categories in more detail. So this was the first one listed, the pro-practitioner markers, and at the top you'll see kind of a mini summary of the metrics within this, that there's a couple here that need support. And then for each row, we have a row number, the metric, a description of the metric, its evaluation, and the reference range so you can see where the patient is falling within that. Now, this category is the stool chemistry panel that's exclusive to Pro, but every category looks just like this. So we're not going to go into each individual one. So what I'd like to do, let's go ahead and jump to page 26. And here you'll see we're still within a category. This is the disruptive microbes category. We can see that up at the top. We're under the opportunistic pathogens. And we'll see the Enterobacteriaceae on row 88. So Enterobacteriaceae is actually a family of microbes that comprises a lot of these disruptive microbes. And because it's a family, you will see in the details that we are actually going to put the top species detected list so that you can see down to the species who— which organisms are really driving the result here. And if they're present here in the disruptive microbes, these opportunistic pathogens, some pathogens have the ability to carry genes to create different toxins. And so here, when they're present, we see the hemolysin E toxin gene was detected, and you will see that with a short description when that is found. If it is not there, it is because it has not been found in this sample. Okay, so now let's jump over to page 32. Here we have a recommendation section, so if you're new to interpreting this, you can go right to recommended actions and you can kind of get some idea here of what you might want to do. Now these are organized into up to 3 steps. We will start with those top priorities and the finding and why we feel it matters, and then we'll give you some different ways to approach this. So these are definitely suggestions, um, just to review with your patient if you want to. It's not a treatment plan or something to keep in mind there. Okay, so let's now jump to page 39. So, um, still in this section here, you're gonna find the different gut-body associations or gut-body connections. So these are really grouped by body system. For each of the different connections that we see on the left-hand side, you're going to see which of the patient's flagged metrics have been linked to that in research. I do want to underline this is not diagnostic. This is not predictive, nothing like this. It doesn't mean people are going to end up with this. It doesn't mean they have this. We are looking at patterns in the microbiome, and we know by scientific evidence that certain patterns are linked To certain body connections, and that's all we're calling out here. So this is a great, great if it's used as a conversation starter with your patient potentially, or if they're having symptoms, if there's patient history that they're worried about, then this is a good place to look. Okay, I'm going to jump now to page 44, and this is into the appendix of the report. So the appendix really starts with your microbiome breakdown. And this is the power, one of the powers of shotgun metagenomic testing is we're going to tell you everything that was found in your gut. So here we can see the breakdown is this line, this colored line, the percentage of unfriendly to variable or commensal bacteria, beneficial bacteria, and then unknown. Unknowns are things that have not yet— Been in some cases even given a name by science, and we're not sure what they're doing yet. Many of them we know by function are doing good things like making short-chain fatty acids, so they're not bad by any means, but this is just going to give you that breakdown. Now below this you will see the top 20 species, and the top 20 species are a little special because we're going to tell you a little bit about them in that species box. So if I go ahead, you can see how those top 20 species are listed. Now below the top 20, we are still going to tell you everything that is in the gut sample down to the 0.005% relative abundance. So here you can see what that looks like, and certainly on the PDF you can do a Command+F, or you can do a find and look for something. If you're looking for something in particular. Okay, so now let's go ahead and jump to page 52. Page 52 is the metrics index, and this is one of my favorite pages because it gives you everything kind of in a nutshell. It has the different metric numbers. These are the row numbers in the report. It has the metric itself, and then it has the result for your patient. And these are excellent if you are doing a retest and you'd like to compare these pages. This is a great place to look. So know that a lot of practitioners find a lot of value here. I'm going to turn the page a little bit so you can see what that looks like. Okay, now we're going to jump to page 56, and this is the last section. This is really great if you are new to our test or if you want to share this with patients. It shows the different different evaluations that we have, how to read the range scale. It also shows you that there is a trend bar that shows up if you do resampling, so you can see how a metric is moving over time. It talks about the hierarchy of our taxonomy, and it also covers the 3 different units of measure that are within our test. On the next page, this explains how to use the recommended actions if you choose to do that. Of course, it is up to you what plan you do with your patient. And then finally, we have a page about resampling. And in a healthy population, we would say like once or twice a year to just check in, but maybe Every few months after a supplement or diet change, if you were doing interventions with your patients, or certainly if they've had a setback, if they've had some antibiotics or something that they might be concerned about. So to recap, we like to start with the overview and the summary on page 6, dig into those detailed conditions as needed. We can review the recommendations if you want a jumping-off point. And then the metrics index on page 52 is a great place to go for a quick lookup. So for interpretation support and resources, you can definitely visit your practitioner portal if you are a practitioner with us, or you can email practitioners@tinyhealth.com if you need any support. Okay, thanks for watching. I hope this was helpful.