PDF Test Results Walkthrough - Tiny Health

Emily Serta walks through Tiny Health's microbiome test report, explaining the risk score, beneficial and harmful bacteria, antibiotic resistance, and functional metrics like SCFA production and methane output. The report includes species-level breakdown to 0.005% sensitivity, phyla ratios, and metabolite markers like histamine and bile acids. Out-of-range results point to next steps: a results review call and the practitioner portal guide.
Chapters
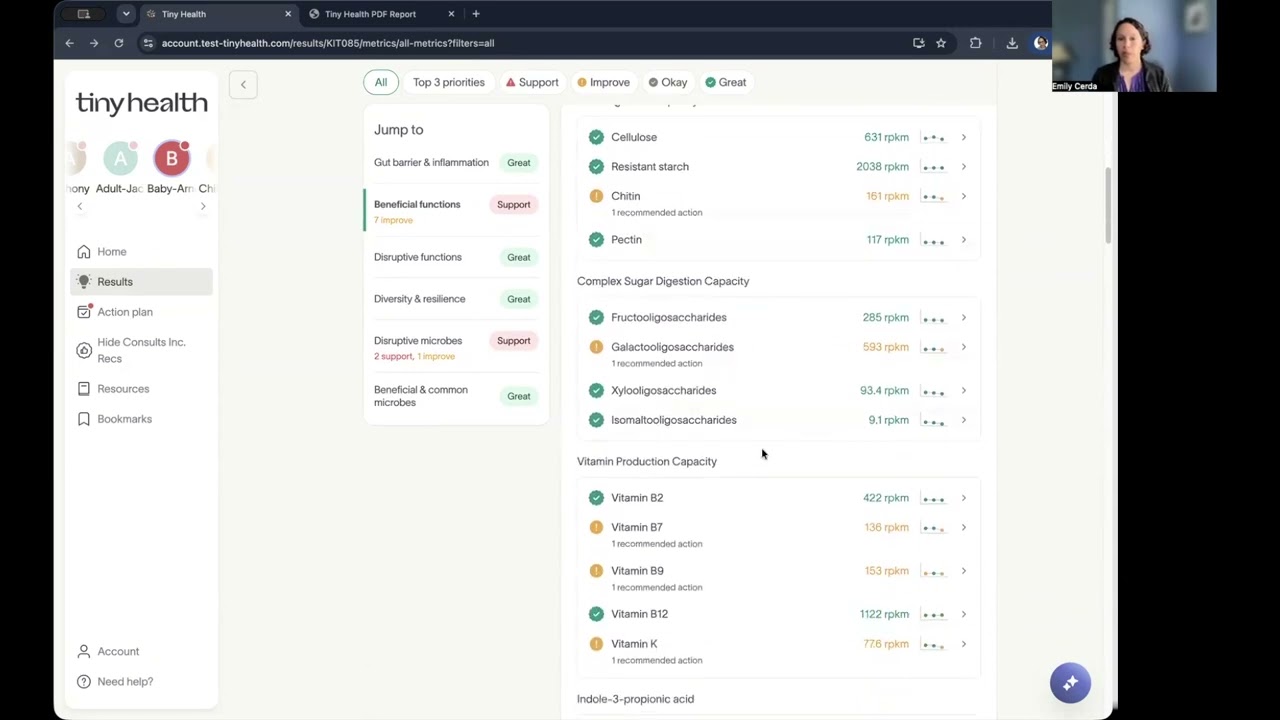
You, I'm Emily Serta, a microbiome specialist here with Tiny Health and I'm going to give you an orientation to our PDF gut test results. Here at the top of the of the results page, you'll be able to see your patient name, date of birth and all of their information, as well as when the sample was collected and the report generated. Down below you'll see a microbiome summary score. The summary score is described over here on the left, but this number 59 is derived from an algorithm that takes all of the results into account. So the reds being in a needs support range where we should take action on them, the yellows being in needs improvement, actionable, but maybe a little less pressing than the reds. Gray metrics would be normal or typical for that age range for that individual and then the greens would be more of an optimal or great range for us. And so the score is derived based on what comes back in the report with certain reds carrying more weights than others, also certain greens carrying more weights than others and all in consideration of the patient's age for for their proper reference range for where their microbiome development should be. We do have separate reference ranges for infants 0 to 12 months, toddlers 12 months to 3 years, children 3 years to 18 years and then adults 18 years and above. Down below the microbiome summary score, we will see a sample at a glance and here you'll be able to see everything that is out of range in your patient's. Further down in the results summary you can see the categories that we break our test into. So pro markers on this test would be stool chemistry markers and you'll be able to look and see that there is some inflammation and maybe some issue with short chain fatty acids. We are also looking at beneficial microbes, disruptives or pathogens, gut inflammation metrics, short chain fatty acid production. This is production capacity. So the ability for the microbiome to create these short chain fatty acids, digestion and absorption markers, balance and robustness as a zoomed out look at the environment, diversity, who is in that gut and at what balance and then microbial enzymes and metabolites, things like histamine, GABA production capacity, beta gluc, beta glucuronidase production capacity within the microbiome. So as we dive into this further down, you'll be able to get into the specific detailed metrics. So for this test, because it is a pro test, you will have the pro markers listed first. Again, this is stool chemistry and you will have your reference ranges over on the Right hand side, so that you. You can see that we want, for example, lysozyme to be below the 500 mark down below. So these are all of our PRO metrics here. Down below, we get into the shotgun testing. If you've just run a shotgun test without pro. Without a PRO marker, without the PRO markers, your test will start with just these beneficial microbes. So for beneficial microbes, we are looking at Bifidobacterium, Akkermansia and Faecalibacterium. We will call out the Faecalibacterium, for example. This is a genus. And then down below, you can see the species of Faecalibacterium found within the genus in this 11.5% that are in this individual's gut. Again, we have the reference ranges over to the right, and those are based on the individual's age. Further down underneath, beneficial microbes, we get into disruptive microbes or pathogens. We have an antibiotic resistance signature which looks at richness or the number of individuals in the gut that may be resistant to antibiotics and abundance, the relative abundance that those individuals are taking up. So how much space are they taking up in the gut environment? Down below, we break those metrics down into exactly what are they. So here we see Enterobacteraceae. This is a family with F here. And this family is out of range. We would love it to be below this 1.2%. We can see this one's up to 14%. Then down below, you'll be able to see specific species in this family that are driving this metric out of range. Again, we'll see the club Ciella here, and that is called out here. With this Oxytocin species, you will see specifically for Klebsiello, what that reference range is. And so further down you'll be able to see all of the things that are either out of range or within range and what that range actually is or should be for the individual. Underneath the microbial pathogens, we will see markers for H. Pylori. Um, we're looking at parasites and infections here. And so you can see some specific species or genus that we are calling out. Fungal overgrowth as well. And then here we have some methane production. And this is a good place to pause to talk about whole genome sequencing and how we are looking at not only the microbes present in the gut, like Methenobravibacter smithi, finding out if it's there or not. We're also looking at the genes present in the sample. For example, Methanobrevibacter smithi can show up elevated as an overgrowth. And methane production capacity or genes in the microbiome to produce methane may be sitting at zero. Just because the microbe is there doesn't mean that it has the genes to perform that function. Whenever you see the word capacity in our test, you are looking at more functional markers of what the microbiome is capable of. Down below we have gut inflammation markers. So we are looking at hexa, lps, lipopolysaccharide or endotoxin production, the index. All of these indices are looking at both the microbes present and the genes present in the sample to come about with the number of the index. So here we're looking to see Asherichia, for example, is great at making lps. And, and perhaps there are also some genes present in this microbiome that are known to make LPS and that will also drive up this metric. So the lps, the mucus degradation, hydrogen sulfide production and host DNA, these are all looks at microbially driven inflammation. Down below we have short chain fatty acid production. And here we have, you'll see the word capacity. And so this is looking at the genes in the microbiome to see if they have. The microbiome has the ability to create butyrate, propionate and acetate. These largely hinge on beneficial bacteria and of course, fiber intake. We'll also report on digestion and absorption markers. So again, we're seeing capacity and this is a powerful look at exactly what functions this microbiome is capable of. Fiber digestion, for example. This individual could use a few more genes to help with resistant starch digestion. And the way to do that is to eat more resistant starches. You may have to start low and slow because you are building that microbial population so that you do have more genes present. But whenever a marker pops up here, it does mean that we need to eat more of that food type. Further down you'll see complex sugars and then protein digestion as well. So we have TMA and ammonia. Here we have some ammonia production being shown. Okay, vitamin production capacity is not nutrient status. These are the nutrients that the short chain fatty acids make and think of them as postbiotics. So, well, a patient may look at this and say that they may need to take some B9, they need, may need help with that folate. In reality, what we need to do is to shore up the short chain fatty acid production by helping with beneficial bacteria and also fiber intake so that the short chain fatty acids are performing the function that they should be and enough folate is being created in the microbiome. We then come to the balance and robustness section, which is going to look at diversity and the overall environment here in this microbiome. So again we have richness and Shannon diversity, which are kind of like alpha and beta diversity. The richness is just looking at the number of species in the gut and the Shannon diversity is looking at how robust are those populations. Gut resilience is something that we do report on and that looks at our resample data to see what exactly sets somebody up to have antibiotics, to have travel, something that would typically be an assault to gut health, and yet their gut health has remained stable throughout that experience. And so the gut resilience score really looks at some markers related to that resilience and gives a score based on how this gut is performing. And we're reporting on oral microbes in the microbiome as well as phyla, which here, the Proteobacteria, those are those disruptive bacteria and we saw those drilled down in more detail up above, we also see common microbiome members and these can be opportunistic. We do need them at low levels and then at high levels they can become problematic. So for these common microbiome members, we do tend to take a crowding out approach because we don't want to take an antimicrobial to wipe them out when we do need them at low levels. You'll see the gut ratios here for the particular phyla, as well as a microbial enzymes and metabolites area where we're looking at histamine producing species. Specifically we're looking at beta glucuronidase capacity, the ability for the microbiome to create beta glucuronidase, again, capacity. For the next two metrics, we'll look at the genes to produce GABA or to produce bile acids in the gut. And then urolithin producing species looks specifically at the species in this report that we, we know will produce urolithin. So underneath the detailed report you will come into exactly what phyla are present here in the gut. And we can see again there's that Proteobacteria, those disruptives called out in this particular report, more information on the gut ratios and what this ratio that's out of range may mean. And then we'll get into the gut type. So gut type is determined by the dominant type of bacteria in the individual's gut. And we can see that this, this individual has a lacto sperceae gut that is great at digesting fiber and creating butyrate. So that may be something that as you're working with the patient you, you want to lean into when it's appropriate in their care plan. Further down we get into the microbiome breakdown. So here we can see based just on a colored line the amount of beneficial microbes variable which are those opportunistic we need at low levels but not at high. Unfriendly bacteria and then unknown, unknowns being bacteria that are in our database, but they have yet to be classified by Science as any of these other categories. So 14% unfriendly here definitely catches my eye as it has further up in the report. Then we get into the top 20 species. So here we can see that the bacteria data and what those mean, the Proteobacteria, what those consist of. So you will get some more information on what's in this individual's gut. The including Enterobacteraceae. Further down is where I like to go where you can look at all of the species in the gut. So here we can see this is listed from the highest all the way down to the lowest which is our sensitivity is 0.005%. And we can see that the largest population in this individual's got is that Klebsiella. And so you'll be able to drill into this and really get more information about the microbiome and the microbial members of your patient's gut and what treatment plan you would like to pursue. If you have questions about this, of course we always want you to feel comfortable booking an introduction call or booking a results review. We will go over these PDF reports and also remember to go into your practitioner or portal and check out the interpretive guide which will walk you through each of these metrics. I'm happy to answer questions. I hope this was helpful in covering the PDF report from Tiny Health.
More from Tiny


Tiny Health Raises $33M Series B to Establish Microbiome Intelligence as the Standard of Care