Colin Brown shows how to paste financial data into a ChatGPT prompt and get back a working HTML dashboard in seconds. The dashboard visualizes revenue and margins, includes interactive sliders to adjust EBITDA and valuation multiples, and exports to CSV. No coding required.
Chapters
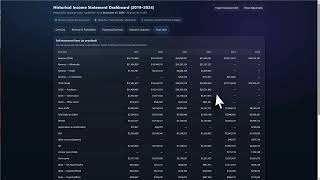
Today I want to show you how to make a custom dashboard that will work with basically any data that you provide it. So let's take a look here. I'm going to hop on over to the AI Data University, and I have posted this prompt right at the very top under Featured Prompts. So it's on the very front page. You can also do a search by just searching for dashboard or custom dashboard. Let's take a look at this prompt. We'll need to give it a role, so the role of the person that we want the AI to act as, and then we need to paste in our data at the end. And I just make a note here, you could make this prompt even better by giving additional information if you know the data that you're inputting in the first place. But this will work with anything. It could be an income statement, a balance sheet. So let's go ahead and copy this. Then we go over to ChatGPT and, and click on new chat. Then we paste the prompt, and then we give it a role, and then we go grab our data. So let me show you how I do this. So in this case, this income statement is— all the information has been redacted, so we're safe to put it up. And you'll know it's in a PDF, which is how you receive most of your data most of the time, which is sad because then you've got to get it converted over to Excel, and you may have problems doing that. But it will work most of the time. But in any case, I have found that if you just highlight the data and then copy and paste. So that's what I'm doing here. I'm just going to highlight this, Ctrl+C, come back over here and paste it into here. And you'll notice it doesn't look very formatted to you. However, it has retained within ChatGPT, it has retained the, the data in the appropriate columns. It's basically a CSV file. Then you just go ahead and you click Run. And you can see here, just to save time, I've run this. It thought for 10 seconds. It will— it may have thought for 10 seconds, but it will run for some time. So just be aware of that. And you can see all this code that it generates. Don't be nervous, it's just HTML and JavaScript, nothing too fancy here. It could have done something more fancy, but I'll go to the bottom and see all the stuff that's been created here. Now in this new version of ChatGPT, you can actually preview it here, but I'm going to show you how to run it locally. So I could click on Preview, but in this case I need to actually copy this code. Let's copy this HTML. Then you just need to open it up in Notepad or your favorite text editor. I like to use Visual Studio Code, but it works in literally any text editor. So you can open up a Notepad, just going to say File, New Text File, and you're going to hit Paste, and it's going to copy all that code in there. You only make sure you've got the entire set of code, otherwise you may have some errors or some issues. And then all you have to do is save it. As an HTML file. So here's the trick. When you do go to Save As, you're going to want to save it in a location that you can find. We'll call this Dashboard, and then the file type, you'll want to select All Files and then say.html. Put that on the end, so dashboard.html. Then I'm going to click on Save. Just remember where it's been saved to so you can find it again, and then you can just go to that location, open it up on your computer, And here is the dashboard it created based on the data that we sent to it. So let's take a look here. If you're worried about the data, you can always, in this case, it created— no, I didn't tell it to do this, but it did it anyway. It created a data table. So you can actually verify that the actual data that it took from our copy and pasting from the PDF, and you can verify that that data is correct. Then you've got an overview, shows the revenue, gross margin, so forth and so on. You can see it's graphed this information, so created some graphs for revenue and profitability. Got margins, revenue mix, cost of goods sold, you've got operating expenses, all graphed. Interesting, it found some add-backs. Interesting. Also, you can increase— you've got a slider here, so you could make adjustments, and you'll see that it changes adjusted EBITDA. Then you've got a valuation snapshot. I didn't ask you to do this, it just looked at the data. And of course it knows who I am and has seen me do other things with dashboards in the past. So your dashboard may not look exactly like this, but it'll be similar and it'll get better and smarter the more you, you give it data. In this case, you can change your multiples automatically and it will change the enterprise value. So very slick. You can also export this summary to a CSV. And if there's other things you would like it to do, you could go ahead and go back and then give some additional prompts. So for example, it suggested that we could add inputs for cash, debt, accounts receivable, inventory. So here's some additional things that it thinks that we could do to improve. And then you can just tell it, I want to do 1, 3, and 5, and it's going to go ahead and rewrite it and give you a new dashboard. So hopefully this will be super helpful. I would probably use this as a backup or something to review some of the work you've already done. Most of you already have your own models and you want to continue to use those models in Excel, but this might be a quick and fast way to review and see if you've got the, the right numbers. So there you go, have fun with this one. It's super fun and super exciting to be able to generate your own code not having any knowledge of any programming, but it's very simple and takes 2 seconds to create a dashboard. So have fun with it.