Reporting in SAP LeanIX Webinar | Architecting the Future Autonomous Enterprise
Dr. Niladri Bihari Nayak walks through LeanIX reporting tools for enterprise architecture, covering nine standard report types like Landscape and Roadmap, then builds a custom Compliance/Security/Risk heatmap using PowerShell, VS Code, and npm. High-quality data and proper configuration are essential to avoid port conflicts and token errors.
Chapters
Hello everyone, thank you for joining in. So welcome, welcome, welcome to our BTM Saturday, Business Transformation Management Saturday session. So let me go through that, and this is the prime time webinar we are conducting for a while. And you can see those details are pretty much available in our platform as well. Okay, and those who want to access this recording and interaction for a long term and interact with us, we have already have sessions planned, already have those access available in our platform. You can go for a Silver membership to start with, and we will be having a lot of similar kind of sessions every day. We are happening it And this recording will be going and available inside. We have a course called Architecting Autonomous Enterprises Business Transformation Saturday Webinar Series, and you can go here and you'll be finding the details part of it here. So this is the enterprise, and these are the different boot camps we are conducting. Also, you'll be finding here, uh, you're typically— and this will be available in the Gold membership. The base camp will be available in the silver membership. Okay, so these are different details you'll be finding. And those who are the new members or you are not part of our members, if you want to share with anyone else, you can go and check it out. Go to transformation.successlabsacademy.com, transformation.successlabsacademy.com, and you can join this webinar. Okay, many of you might have joined using this free access. Okay, in this you'd be able to see the, you know, attend the live session, but the recordings will not be available directly. Okay, so this is the flyer you can share with anyone in your college, universities, your corporate, right? And you can grab this free sheet. Okay, so you can scan the QR code and you can go through it. Okay, so now with that note, let's then start— get started with today's topic. And we will be starting with today— let me go ahead with the tool called LeanIX, and this is the tool which you have been using for any kind of enterprise architectural management point of view. But today we will first session be focused on the reporting side of it. First of all, we'll be checking out what are the reports, standard reports available, and how it is fulfilling our requirements in a day-to-day. Then we will be going for the other topics. So when you say reporting, you will be finding here there are different reporting types. You can have landscape report, matrix report, portfolio report, Circle Map, Cost Reports, World Map, Road Map, Radar, and other. Okay, similarly, now we have AI Agent Hub, and then AI Agents we are having. So many things are having here. Okay, anything you are doing it recently or you have been doing it in your report sections, you'll be finding the My Report section, Recently Used Reports. You'll be finding here many of this. And, uh, yeah, so this is what exactly we're getting. Okay, so before you go into the detail part of it, we will be seeing, uh, what are the reports available, and based on the types, you filtering will them out. Okay, so first of all, we're checking out the landscape report. What are the landscape reports available? So these are different landscape reports available. You can see that we will start with maybe the very commonly used application brand landscape. Okay, that means what are the applications you are having in your organizations across the years, across the business capabilities. You can see that those things are available here. Okay, so I will just make it sure. So in the application landscape, I can see that I have, uh, these are the business capabilities. B stands business capability, uh, your data analytics. Okay, we have, uh, these are the active. Okay, you can see, and this category is also based on the color code. You can see that these are active. Okay, under data analytics I have a Power BI, I have a QlikView, I have a BW Analytics Cloud. Okay, and phase-in, and you're planning for to do this also. Okay, similar finance and controlling, I have this much procurement. I'm having Coupa Ariba, Concur, okay, and SAP SRM has been phased out. Manufacturing operations, I have Aviva, okay, I have a Verum MES, QualityDB, MS Access. SAP Digital Manufacturing has been phased in. IT platform integration point of view, I do a Microsoft Entra, SAP PO, SAP Integration Suite, SAP BTP, ServiceNow. We have from a sales and customer management point of view, I do have SAP CPQ, SAP Sales Cloud. SAP Salesforce Marketing Cloud, Siebel CRM is phased out. Supply chain point of view, I have WMS, SAP Integrated Planning, SAP EWM. Okay, so these are modules I'm having in here. HR point of view, I'm having SAP SuccessFactors phasing in, and we are having SAP HCM on-premise, Moodle LMS, Atos time tracking. So in this way, I can see all the things here directly. So this is my very popular We have an application landscape, and also if you want to check any other view, I can also find out here. Suppose I want to see in a different way, this is a lifecycle view, and there are different views you will be having. So this is my lifecycle view. Suppose I want to check on the functional fit, so I can see this is my functional fitness point of view. I can see which are typically, this is the view I would be getting here. Okay, and similarly, if I go here, okay, technical fit. Okay, so it has not been color coded. You can see some of them are color coded. Okay, that means it's adequate, right? Whether it's adequate. So that for that we have to have a good data point of view also. If you have not data is not properly maintained, it will not be coming up. Okay, so this is from a technical fit point of view. And similarly, if I go for business criticality, okay, so I can also check it out. It is this, this should be color coded, okay? Otherwise you will not be finding this things aggregated risk, okay? So this is also I have updated here. There is no risk for this, okay? But others I can update the risk parameter, okay? It is missing. You can see for all of these things is the missing IT component information. So once you update, it will be coming up here. For SAP EWM, I have already updated that, so it is showing out here. Okay, risk, uh, no risk here. Okay, so there are different, different views. You can see hosting type. Okay, hosting type also for here I have mentioned as a SaaS. Okay, and for that reason it's coming up. Okay, similarly if I go for single sign-on, there's a single sign-on available. You can see that it's available here. And time classifications again. So time classification is again pretty much available for every product I can see. So time is nothing but, uh, The kind of classifications we do it, whether we are tolerating it or you are investing it. Investing means whatever green color you are seeing it here, and migrating, that means this is on a transition phase. And the pink color or red color, you can see that these are all eliminating. So we are eliminating, let's say, ECC. Most of the cases you are seeing ECC, SAP PO, SAP SRM, SAP APO— these are all modules we are eliminating. So in this way, you can see the application landscape very nicely. It has been Presented, and this is the reporting part of it. Six R strategy point of view: whether you are having rehosting, retiring, re-architecting, replatforming, retaining, or repurchasing. Based on that, the six R classification also we can view in the in the same application landscape. One application landscape, but you can see there are different different views. Okay, so this is we call as a report, but you can see how many views we are having it. Okay, I want to check it from AI agent status point of. View. Okay, so there are so many agents, but these are all unverified. You can see agent verified, agent unverified, agent rejected, right? Similarly, completions point of view, data completeness. Okay, so you can see many of the things we have not completed the data. Okay, so in this way you can check it out. There are different, different views. Okay, similarly, if I go for fields and relations point of view, okay, TCO point of view, again there is a different view. Okay. So you can see, so one report but there are different view of it, okay, of the same thing you will be finding. There are different data object usage point of view, okay. You can see there are different color update archive, okay, many of the views, okay. So you can see this is not only simple report but again, so you'll be finding a lot of things here, okay. So AI agent, AI risk, AI priority, so many views are here, right. So whenever you're building any such reports or dashboard or something like that, first of all verify whatever existing material already there. Okay, so you can see they're all my existing business applications, AI agent. Similarly, these are all AI agents. AI agents are everywhere now, you can see. So AI agent is functional if it or not, I can check it out where these are my applications I'm using it, and inside that which is perfect, appropriate Only thing is you have to have data for that. Okay, so we have to also understand where exactly this data are maintained here. Okay, so business capability, IT components, initiatives. Okay, initiatives also I can check it out which initiative. Okay, so this is the way I can verify it. So it's all about the application landscape. I'm not going further detail, but this is where I have seen it application landscape. Similarly, how many other such reports are here? You can see in the landscape point of view. We have an AI agent business value. Okay, so AI agent business value. This is the entire dashboard we will be looking. So at present we do not have any data point. So otherwise here also we can verify. Okay, at present we do not have it. Okay, so this is an AI agent specific agent business value. Then we have something called AI agent landscape exclusively for AI agents. We are having it. Okay, so here also we have not having. We're not having anything called agent verified. Okay, so all these details are not available. Okay, so that is again the reports is available, but we have to capture it of this thing. Okay, then next is your application landscape TCO allocation per business capability. Okay, so for every business capability, what is the you know total cost of ownership? Okay, so you would be going here and check it out. You would be finding. All the details here and the facts with the relative related, okay, total cost of ownership if it is maintained, okay. Otherwise you will not be finding here, okay. So in this way we can go here and update here, check it out, okay. So this is a TCO point of view, okay, and you'll be finding all the details here, okay. So this is the application again, another way point of view landscape. There are different, different, uh, mapping business capability map. So this is also you'll be finding for the entire life cycle. Okay, so if you are having it, you will be finding all the details here. Okay, so these are different current maturity level and everything, business capability map. And, uh, I think this is enough. Initiatives and landscape, initiative landscape also. If you're having initiatives, you'll be finding all those initiatives. Digital ledger transformation is an initiative, right? You can see all the details. So similarly, we can have many initiatives, and that is something we can update here. Okay, so all depends upon the data. Okay, so this is similarly we have applications and their agents. Okay, so this is already we have seen it. IT component landscape. So at IT component level also, for every applications you might be having so many, you know, IT components. Like integrations point of view, you might be having SAP BTP runtime, SAP Integration Suite, SAP Integration Patterns point of view, IDoc, ALE, OData, REST API, Customer RFC. That visibility you will be getting from here directly. Okay, so this is one of the things we are seeing here. Then what we will be having here is this is the landscape point of view. Okay, so now we will be also going to the next part of it, which is a matrix report. Okay, so the matrix report will be looking like something this. So we have few again, application matrix, initiative matrix, IT component matrix. If I go here in application matrix, so if I go here, so all the in this matrix structure you can see this is a corporate. In the corporate, if you're having, you know, so like it is like your different different, you know, you will be seeing corporate is using this applications, your finance and controlling point of view. These are the things. Human Resources, IT Platform Integration, Manufacturing Operations. Okay, your plants, you are having different, different plants. Okay, they are having Manufacturing Operations, Supply Chain. What are the tools they are using for supply chain? You can see all the details, right? Similarly, your different plants will be having different things. So you can see this is another view. Okay, this is a matrix view. Okay, so you can see that is in the matrix format. You will be able to see, and if anything you like to go to deep dive, let's say SAP Ariba I want to check, I can go and check and from here I can see the business capabilities and this is the organization procurement and sourcing, organization is a corporate, okay, was using it, okay. Similarly if I go to Ariba PI system here, I can go here and check it out, so this is my business capability and these are organizations who are using it, okay. So in this way I can see the application matrix as well. So this is again a standard report I can— which already available, I can see. Then it's your initiative matrix. So if I go to the initiative matrix, I can see whatever initiative have been taken for that. Okay, so I can see the digital HR transformation is the only initiative I'm having in my system, right, which I can show. Missing data. Okay, if it is missing data, then it will ask you to update for data. Okay, this is for my initiative matrix. IT component matrix again. So here I have, okay, at present we are having this is the one, this is the list of fact sets and everything. I can see all the things, this is the IT component point of view. Okay, so this is the second type of report, landscape report, metrics report. Third one is a portfolio report. Okay, so we will go into the portfolio report. How does it look like? So portfolio from an application, let's say Tribe is a very common used application portfolio, and in the application portfolio report you can see there are 14 3 fact sets with the missing data. Because it's a missing data, it is not showing. Otherwise, these are list of report, okay, which we can utilize it and practically it will be showing here in this report, okay. So now we will be going here, okay, and let me show you that. Huh, so this is the excluded, okay. Anyway, if you want to include, we can also include it here directly. This will be shown here in the x-axis. So there is an x-axis, we are having a functional fit, y-axis we are having the technical fit, and based on that it will be appearing here in the application portfolio. So if you are already having access to the LeanIX system, you can always go back and check it out what are the different reports look like. Provider portfolio, so here we are having a section here again, so provider quality and provider criticality. So based on that you will be also bringing in this kind of a report. Here. So this is a— we do not have any data for this as well, so we have to have data and according to that it will be appearing here. Okay, so there are different types of portfolio type report you can see. The next category is your circle map. Okay, so if you go to circle map, so this is an interface circle map. So in this kind of a report you will be finding, um, it will be also telling you that, okay, you can see this looks like a pick up anything There's a ServiceNow. So if you go to ServiceNow, it will telling you that it's connected to what, checks it and how it is connected to, okay, it is SAP SuccessFactors. You can see it is having SAP connected to SAP HCM on-premise, Microsoft, you know, then Atos time, okay. So this is, this is the way you can see. And actually it is from the idea is here, who is consuming the data, consuming from where, and provides data to Okay, so SAP S/4HANA consumes from, consumes from where? You can see all the things. Okay, SAP Sales Cloud consumes from. You can see which is consuming from. This is the symbol, and which provides to which symbol. And if it's both, you will see this symbol. Okay, so from that you can see the civil CR consumes from, you know, no sorry, SAP S/4HANA Finance and ECC 6.0. Finance consumes from, so from this one. Okay, so you can see in this way. Okay, so this is the way I will be. You can check with the intercircle interface circle map. This is another category of map. Then we have a cost-specific report. If you are having any cost associated, you have a provider cost. That means all the vendors they have a cost, right? This is just an example report. Okay, so. Again, for every cost, for every software, every applications, how much is the cost you are paying, okay, you are investing, right? For that, if you find here, similarly, from a business capability point of view, you will be finding for each and every business capabilities again, like cost per business capability, okay? So in this way, you can see HR is spending how much. So in this example, $1,356K. CRM is actually having the highest number of कॉस्ट 2662 की, ओके एंड इफ यू गो फॉर अदर यू विल फाइंडिंग इनोवेशन में स्पेंडिंग 133 की, मार्केटिंग में स्पेंडिंग 1124 की इन यूरोप। सो दिस इज़ द वे यू कैन आल्सो वेरिफाई द बिजनेस कैपेबिलिटी कॉस्ट पॉइंट ऑफ़ व्यू। ओके सो दिस इज़ द अनदर टाइप ऑफ़ कॉस्ट रिपोर्ट्स know which application is utilized in where if you're having a global company and which application, which location has been using it. Okay, you can see that geographically data. Okay, that is what exactly is expected here. Application usage also, you can verify which application has been used in which country or which location based on that. Okay, you can verify that. IT component also, you can find out which component has been used at what location. Right, so these are the lists we are already having, but only thing is we have to have those data ready. The data quality is very, very important here to maintain, otherwise this will be misleading reports. Okay, so world map report we have seen it here. Then we have a roadmap report. Okay, so type of report in the roadmap, it is pretty much easy. So for every applications we have a dedicated roadmap. So if you go here, you will be finding like this. So it will show you in here, let me show you. So it is refreshing. Yes. So you can see that for every applications we have is if it is an active and when it is phasing out. You can see for SAP HCM on-premise is phasing out from when? September 29th, 2028. Okay, so that is the date they have targeted. Similarly, for every module you'll be finding there is a, you know, phase out active or what is end of life. You can see everything, right? Okay, this is the each and every application, the roadmap you can visualize here. Okay, so that is the way you can go and check it out from this particular SAP SuccessFactors. You can see this is a phase-in and they are now implementing. You can see phase-in from 1st of May 2026. Okay, and now we are continuing with— okay, so It will be active. That means it is okay. It will be active from first of January, 2027. Okay. Currently, we are just implementing. Let's say. So you can see that as in success factor, how does it actually work? Okay. It is going to implement it from this particular day. Okay. So that entire thing you can see it here. Same goes for that. See, the data sphere is coming from February. Sorry, January 30. Okay. So you will see that this is the one is coming from here. Which date? Okay, 1st of February. Okay, so 1st February 2027, right? So in this way you can see for each and every application, you can see the roadmap, application roadmap. Okay, so if you see another initiative roadmap, initiative roadmap was very similar. Which initiative starting from when? Okay, you can see digital HR transformation, this is the one, and currently we are starting this one. Okay, and you can see all the details here. Okay, this is an initiative roadmap. Similarly, IT component roadmap also, you can see from where actually it is starting. Okay, for each and every component. Okay, at present we do not have much detail, but this is a view we will be having here. Okay, so this is the roadmap view. Next one is a radar one. Radar report will be looking like something like this, exclusively for application radar and technology radar. You will be able to see all of this. Thing. Okay, so let's see this. Okay, so this is, uh, you will be finding, okay, business critical, mission critical, admin service, or business operation. And for each and every, uh, you will be having, uh, for that particular, we are having a business functional fit and business criticality. If these are filled up, you will be finding the entire list here. So these are the different, uh, topic, and you have to ensure these details are available here here to get this data. Similarly, if you go to Technology Radar, Technology Radar also you'll be getting this kind of an information. At present we did not have data, but once it is done, you could be getting for each and every area like tooling, infrastructure, data management and storage, language and framework. For each and every, you have to have facts filled up and you would be able to see this report here, Technology Radar point of view. Similarly, if you go for AI Edge and Governance point So here, from a governance point of view, so defining there's a pre-built expanded or a pre-built, okay, or it is custom, okay. Again, here you'll be having again as an unverified agent rejected, all these things, all the details you'll be finding here in the AI agent governance point of view, right. So now these are the different radar report types, okay, and I think these are the 4, 4, 4, 4, 8 varieties. Of, of the different report types. Now we are having another— so I think 1, 2, 3, 4, 5, 6, 7, 8. Yes, 8 types of reports we have seen. And the last one is miscellaneous. Okay, if anything is— if you need your own way and you want to create your custom thing, right? So this is a way you can do it. Lifecycle and aging report. And you can always check it out, how many are active and how many are phasing out. As we see, we are having currently, as we speak currently, we are here and we are having an active, okay, 31 and phasing out 3. Okay, so in this way you can always look into this. So there are 9 varieties. Last one is the miscellaneous if you are counting as a custom or something like that. Okay, so we have seen these are different types of reports. So which one is your favorite? And also there's nothing of favorite, you have to have a mix and match of every reports, and depending upon the business requirements, again you have to customize it, a little bit of tweaking it, and but ensure you are, you know, getting the value out of it. That's the idea, and this is way how we utilize the reporting part of it. Okay, so now we will be going to the next segment. So let me go to the next segment. After the standard report, suppose we want to create some custom report, right? So in this we will be trying to understand how do you build, and for that we already have certain case studies have been identified. Maybe I will be taking you through few of them. So let me go to my AI and few case studies I have already predefined here. I will quickly showing you that here. Let me go to my AI library. Okay, so now I will be going here. Let's say, so this is the AI library I have been using, and for this we are having a custom report. And let me go there. So few of the things already we have done, some of the homework. Okay, and we will be looking at few. So there are so many custom reports we can build in, but we will be starting the very small one, compliance security risk heatmap. Okay, and to do that, so let me go to the what we have already done it. So we are using VS Code and a little bit of, you know, I will be showing you how exactly this has been done, or I am planning to do a little bit extra for that. So let me show you that. Okay, just give me a minute. I have kept it here inside PowerShell. I've been using PowerShell, I have been using VS Code here, and let me show you that. Okay, so I will go here. Okay, so at present I'm not having a little bit of a data issue. So I will be going here to maintain few data, and to do that I will be restarting my PowerShell, Windows PowerShell, and I've been using a VS Code as well. So I will be opening both and let me show you how exactly this is done. So I'll go into VS Code, Visual Studio Code. Here, these are the applications I'm showing you. I have done few things in earlier. Let me show you that as well. So this is the compliance security risk, the code we have done it. And this is what actually, uh, the risk scoring, the application backup, okay. Compliance security risk, uh, heatmap we have done it, okay. So now the thing is we have to execute it. So how do I do that? So before that, let me Ask it. Okay, so we'll make the report. So the real Reliance application, Reliance has no assessment, so not applicable, not assessed, not zero or low. For risk score, use the fields that are actually available, don't manufacture compliance values. Okay, so now what I will do here is, um, okay, TypeScript, TypeScript language is there. So what I will do that 43 applications we are having and these are the different types that we are having it. Okay, so now let me see the prompt. I have activated now the PowerShell and VS Code. Now I have to start again. So suggest the steps again to restart this report. PowerShell VS Code. I have to start again, suggest. So these are how we customize it. Now suggest the steps to gain the start the report with CD. Okay. Okay, I will be starting clean slate and this is our project folder and this is our— first of all, I have to change the directory. So by default, when you see, you'll be seeing the directory like this, Windows System32. I have to go here and change the directory. So now I came to this particular particular directory called Compliance Security Risk Heatmap. Okay, so now what I will do, I will be going here, I will check the PowerShell again. pwd, that's my present working directory. I will be going here, I will be updating here. You can see that this is my path. Okay, and Compliance Security Risk. So in my folder also I can view that. So if I go here C drive. Okay, so I will go here then. Windows C, Users, Nirnayak, and we have a compliance security risk heat map. Okay, so these are things which we have already done. You can see that, and some couple of MD files also we have created earlier, and these are the different files This is a VS Code file, MCP. You can see the details, JSON source file here. Second one is node_modules. There are different modules, all these files have been generated. Okay, it's there. Similarly, if I go to src file, I can see these are the my, you know, TS file, file folder, CSS source file, TypeScript. Again, these are the my TypeScript source file. Okay, so you can see that, right? So now I will go here and Linux projects, you can see. Okay, so this is the folder. Everything is done from here, from this side of it. So we have Copilot, Codex, Gemini, everything is there. Okay, so now what I will do here, I would be going back. I should see all of these things. So now I'll be checking the project. So I'll be checking this one as the next point. Let me do that. Directory dir. So I will see, ha, this is my project structure. I have already seen, okay? Agents, cloud, everything is there, okay? tsconfig, all this white.config. So now I will be going to the next part of it. I will go here, open the project in VS Code, okay? So I will go to the— already I have opened it, but still I will be doing it from here. Code dot Okay, it will be opening the VS Code. I can see that. Okay, so now once it is done, so I will be going to the next part of it. I will go here. Do not type this. Okay, that is fine. Now check this src structure in the VS Code Explorer. Expand this. Okay, I should be able to see this thing: src/config/types/utilities. Okay, I will go here. This is my src/config/types/utilities. Config, types, and utilities, utils. And if I go back, what exactly they are expecting here? Config is having a framework. I can see that framework risk scoring. Then we have types. It is having compliance and risk, compliance and risks. Then we are having utils risk scoring, risk scoring utils having a risk scoring. And then we have app.tsx, app.tsx, CSS. Okay, we are already having it. main.tsx and white-envd.ts. Okay, so this is the structure. Okay, so now this is already— we have been testing it. So the step number 5 is start the Linux development server. So how do I do that? So for that we have to run a command called npm run dev. So I will be doing that here. So let me run this. This This is a very important step. After doing this, I will be putting it here, npm run dev. Okay, so it will be running this, it will be opening it up. So now this is the link of my custom report where my SAP Linux custom report is running. Okay, so now I will be clicking this. Okay, so press H+Enter to show help. So what I have to do is, so there is a command you'll be finding, how do you manage it. Okay, H+Enter. Okay, H+Enter. I'm putting this quickly. So these are the different shortcuts you can see. Suppose if you have to open the browser, if you are not able to click— I cannot see click here, but what I can do is O+Enter. If I'm doing it, I can so open the browser. Okay, so I will be utilizing this. Otherwise, there are different keyboard shortcuts they have given. So I will be utilizing O+Enter simultaneously. Okay, so This will be opening in my host. This is the workspace I have been putting it here, and I can see the compliance security risk hit map here. Okay, and these are different applications which I'm already having it. So at present it is showing no major risks in any of the applications. Okay, so these are the applications of 43 applications. Applications I'm having it like atos time tracking to kupar to legacy cells SAP Ariba SAP APO SAP BTP BIP extended warehouse management SAP SuccessFactors okay ServiceNow okay these are different different applications I'm having and it is score point of it is showing zero risk level is zero at present I'm not having any major risk factors detected okay from this compliance security risk hit map point of view. Okay, so that is the current status we are looking at. Now if I go to the next part of it, what exactly we are looking at? Now I will be going here, I will be going to my next segment. What exactly you are expecting here is, uh, yeah, so I have already done that. Okay, so this is already having been showing. Leave this PowerShell window running, do not close it. Then we'll be opening the report. Okay, already we have, okay, into a browser. The report should connect through lx.init and then retrieve Linux init. Okay, this is fine. Our first priority, get real Linux data. Okay, so for to do that, report was 43, but every field was 0 out of 43, which we have already seen it, right? So now which you are trying to do here in this segment, okay, this it is showing everything is 0. Okay, Extended Warehouse Management, it is showing something because it is having some score here. Okay, the scoring is 5 here. Okay, that means some data is here. Okay, so we can see that because we filled up some data there. Okay, so score is 5 here. Okay, so now we will try to go further and we will be going here. Again, 0, 43. The strong leading is the facet was not Requesting all the application attributes. So now we need to application facet request in the actual Linux script. So important sections here, what we are looking at. So here is should contain this much. Okay. So now the it should be having this much. Linux classification six star classification six star risk classification six star time priority AI risk hosting time status as so. So now this Reporting API is using this facets attributes list to determine which factors should fill return value. So do not change the scoring engine. So I'm not going to change it. Okay, so now, uh, what exactly we're doing is run this one at a time. So a few commands we will be looking at. So let's see that immediate commands, run these commands one at a time. Okay, so we're running this command. Let's see that. Okay, so how do I run a command? So I have to to open a new, maybe, uh, yeah, spend time before we spend. Okay, we discovered earlier. Okay, now what I'll be doing here is I will be going to PowerShell here. So I will be going here PowerShell, and from there, okay, I will be putting this. Okay, so this is the thing which I got it. Now I will go here PowerShell is a code here, so again from there I will go. It will take me to the VS Code anyway. And inside this, what we are going here to do is PowerShell this one, okay? npm run dev. Okay, so let me try to do that. So it is showing some error, I think. But it is okay. So it is showing compliance so and so. Okay, so I will be putting this screenshot. Let's see what is happening. So inside this Windows PowerShell, and I'm having this, I will say that this is what exactly I'm getting here. npm run dev. I will put it here. So now I got this. It is analyzing it. Port 4200 is already occupied by another Node-RED process. Okay, that is fine. In the same PowerShell, we'll be running this command. Now let's see that error action silently continue. I will be going here and I will be putting here this one. Some connection is there, also is there. Okay, okay. So now this is the local address, remote address, local port, remote port, state applied setting. That is fine. Now fine. Now kill the process. We'll be killing this process. So how do I do that? So I will be doing this. Inside this window, PowerShell, we'll be putting this. Okay, it is having some issues further. It is not killing that process. We will be putting here how to do next. So this is the error we got it. So I don't have to go further. So you will see that this is the issue We have got it. So this is a part of our troubleshooting anyway. So in this journey, we'll be looking at. Ha! So do not use one two three four five. They're saying that you have to. Oh, okay, okay. I have to get the real PID. Okay. So to do that, I will be putting this command in PowerShell. Whatever I'm getting it, I will be. Putting that here. So this is the 42124, right? So if I put it here, let's see what is coming up. So I will be going here inside this, and let me do that. So if I go here, let's see what is coming up. So now I will be checking out few things. Okay, so This is the power, the process which you are owning it. Okay, so now I will be running this particular PowerShell command, then I will be verifying this. So I will be going here, I will be putting it here, stopping that process. Now what I will do, I will be verifying it. After doing that, I have to verify here the local port, the error action silently. So let me check it out from here. Let me put it out here like this. So let's see what is coming up. Okay, so nothing is coming up, but anyway, so I think no error also came up. That is good. Okay, if nothing is written, port is free now. Okay, then start the report. Okay, why would you starting the report now? Okay, so the report is starting now. And anyway, so the report is already starting. Already we have done that. Using so and so, and no. Okay, do this commands in sequence. Send me npm run dev results. Already this is running, by the way. So this is already running, and I believe this is okay. Okay, so this is fine, perfectly fine. Provide v point system report is running so and so, and you can find it out from here, right? So I will putting screenshot, and now we will be going to the next step. Okay, so let's see. So if I go further, it will be analyzing that image. The server is now running successfully, so we have reached the correct starting point. Now the important security aspect is token. Do not share that URL further. Let's generate a fresh token. Okay, so in the PowerShell they're saying press Ctrl+C, Ctrl+C. Okay, then run this one. Okay, okay, Ctrl+C. Okay, then what they are saying here is we have to run the next code, next command. Okay, I will say that server is running or not. Okay, so this is something we'll be verifying here. So now let's see that. And okay, now this is again running. Okay, and so I will say that yes, server is running. Then we move directly to the actual report, not styling it. We will be opening this and make cleanix report so and so. Okay, so now what I will do, I will say that the server is running. Server is running. Okay, so let's fix the Linux data issue. Okay, so we will be going to the app.tsx. So open in the VS Code. So this is the VS Code app.tsx, and from there we will be going to the Explorer src. Okay, this is the Explorer. This is the src and we have app.tsx. app.tsx is already there. We are there, we are looking at— so we are having here in this code, we are having import, we are having interface from attributes. We will She can take it out. Where is the attributes? Okay, we did not see the attributes here. Missed out. These are the different, uh, fields to check attributes. We can see that these are my attributes: ID, display name, business criticalities, and all, right? So now what I will do here, attribute so-and-so, replace only that attributes block replace it with this. Okay, it is already there, by the way. ID display name is already there, so I will say that's already there. This is my VS Code, and from here what we see is— so I will put this entire thing here. So step 3 is already there. So let's see what it is saying. Yeah, so now do not change in this. Now step 4, scroll a little down to the section of the beginning. You already have TypeScript, this That is good. Now press Ctrl+S. So let me check it out. app.tsx section beginning TypeScript callback TypeScript. Okay, app.tsx callback data. So it is calling back the data callback data. It is there already. Console Linux application data actually picking up. So now we have Ctrl+S then go to Linux in the browser. And let's look at the report itself. It's still— then we will inspect the actual— written by— I don't know what— by so-and-so. Okay, that is fine. So now I will be saving it, Ctrl+S. Now what I'll be going to do here is I will go back to my Linux reports. So I will go to my dev/linux, this is the report, and I will be refreshing it. Okay, so this is how exactly— okay, some error is coming up. Error in loaded report. Okay, access to shared documents denied to origin. Oh, okay, so this is some kind of a report being caught in error. Maybe we will note it down. So this error we got it from here.
More from Dr.

SAP Procurement with SAP LeanIX x SAP Signavio Webinar | Architecting the Future of Procurement

Global Compliance Navigator by Dr. Niladri Bihari Nayak | SAP LeanIX Sep 2026 Contest Entry

SAP LeanIX to SuccessFactors integration Webinar | Architecting the Future of Work

2027 Leadership for Enterprise Architects : What Changes ? | Architecting the Inner Transformation


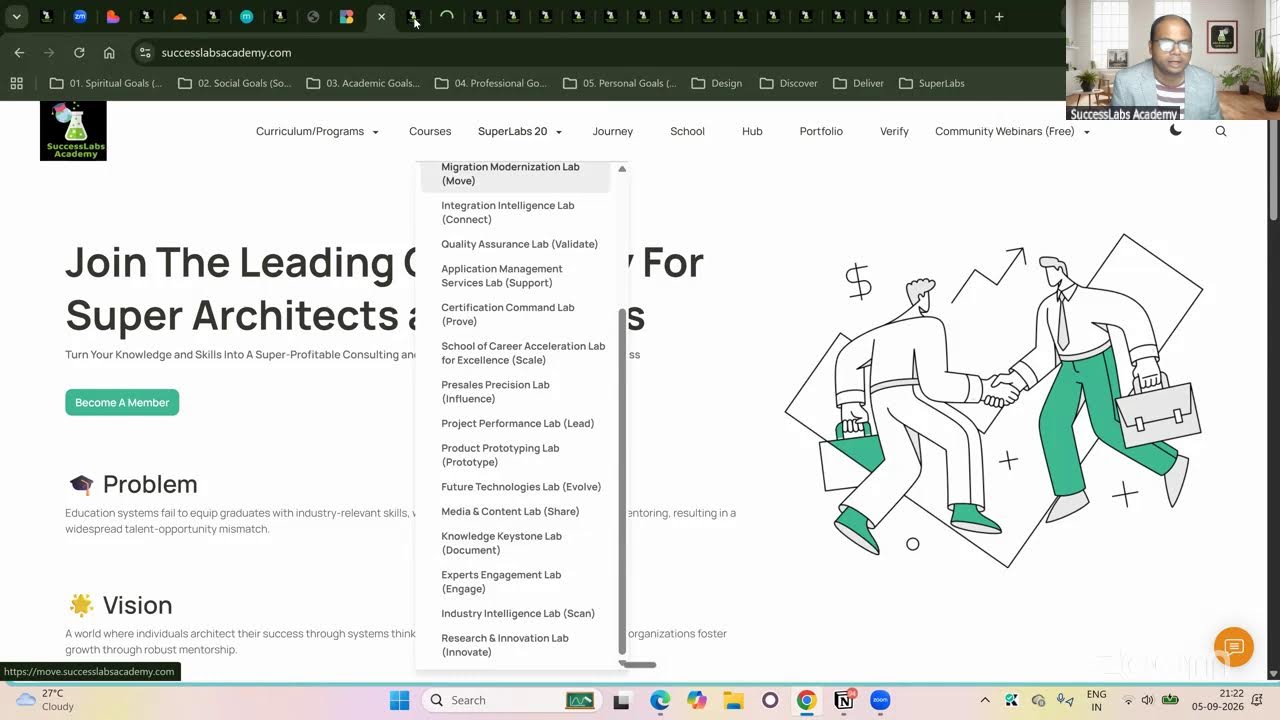
20 SuperLabs for Architecting the Future Autonomous Enterprise (Business Arch & Enterprise Arch)