Colin Brown shows how to set up pipelines in eBiz Suite, which track the stages clients move through in your sales funnel. You can create multiple pipelines with custom stages, view conversion rates in funnel and pie-chart visualizations, and toggle which stages appear on your dashboard.
Chapters
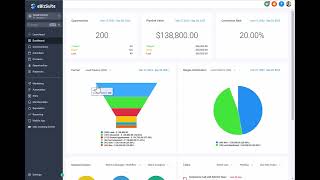
The next step we want to take in setting up our eBiz Suite is to set up your pipelines. You do that by going to Settings and then Pipelines. Then you click on Create New Pipeline. Let's go ahead and edit one so we can see an example of what might be. So a pipeline are basically the stages in which a client would take as they go through your sales process, your sales funnel. And this can be designed in any way you want, but it should mimic your typical client process or the process from lead to becoming a client. So in this example, we've given a name called Lead Pipeline. The first stage is lead, then interested, then booked appointment, not interested, and sold.. And of course you can make these visible in the funnel chart. You can also make them visible in a pie chart by turning those on. You can also turn these on here and off based on what you're trying to accomplish. Click on save. And to see where that shows up, let's go ahead and click on go back. And here you, in our dashboard, you can see our lead pipeline funnel. You can also see the stages of distribution for that. Now you'll notice that you can have multiple funnels going on, so you can choose this down arrow and change to a different pipeline. There's no data in that particular pipeline, so we'll hop back. But this is where this is shown. You can see how many leads, how many interested, how many booked appointments, not interested, sold, and won. So you can get your conversion rates, which is how we get that. So back to, you go to Settings, Pipelines, and then in your case, you're gonna create a new pipeline. Let's just create one very quickly. So we're gonna call this pipeline Lead Magnet AI Cheat Sheet. Now I've set up an actual marketing funnel that's going to mimic the stages. So the first stage that they're going to take in my funnel is to— and I'm going to click on Add Stage. The next stage or action that I want them to take is to reply to an email. If they've replied to an email, it's going to move them into the next stage, which is to watch a webinar. Once they've watched the webinar, the next step would be to book an appointment. And then the final stage would be to become a client. So these are the stages in which a prospect might go through my website to learn more about what we do and what we offer until they become an actual client. Now, when I create this new pipeline, if I go back and I look at the dashboard, I can now change this funnel to this new AI cheat sheet. Of course, there's nothing in there at this particular moment, but that's going to create a chart just like this so we can see how many opportunities, where they are in the pipeline, what stage they're in, and so forth. So that's how you create a pipeline. You can have an unlimited number of pipelines, which are basically marketing funnels. Which are displayed in a graphical format, as you see here in an actual funnel and also in a pie chart. And depending on how we set those up and what you want to see in each of your stages of distribution, these can be turned on and off so you can see where everybody sits in your pipeline.