Analysing your data
Amy Guy walks through email marketing analytics using a real example: a 71-person waitlist and an email with subject "there's more to life than this." She defines open rate, click rate, bounce rate, and revenue attribution, then shows how to rank emails by click rate to find what works and spot tests to run.
Chapters
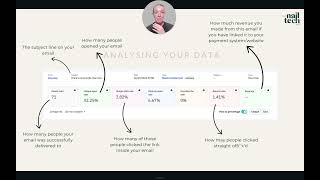
So now we move on to tracking your email data and what every metric means for you. We already know how to track our analytics when it comes to social media, but emails are so important as well. Now I've taught you everything to do with emails so far. I want you to know how to actually read your data. And the good thing is with emails, it's actually quite simple. So everything you do when marketing your business is a test. We've already learned that when we covered social media. But in order for us to take the learns from this test, we have got to regularly review, review the data that we are provided with. Just like social media, there's no point in sending an email about, sending an email about something and then getting absolutely gutted when people don't buy or people don't sign up and just leaving it there and never doing it again. The good thing about emails is that the data is all done for us, the reports are all done for us. So once we've got that information, once we've sent one email, we've got everything we need to be able to read between the lands and know what to do next. So just from you sending one email, your first one, you're gonna know exactly what to do next because the data will tell you and I'm gonna tell you right now. So this is a screenshot actually from my email marketing system. Okay? So when you click into an email that you've sent, it will tell you the subject line of the email, it will tell you what list it went to, and it will tell you all of the reportings on that specific, specific email. So it'll tell you how many people it was sent to and then all of the other numbers which I'm going to go through with you now. So for the purpose of giving you this example, this was our wait list that we had for one of our beginners courses. Okay, so we had 71 people on our wait list for our beginners course. Off the back of that, I sent out an email that said there's more to life than this. It spoke to those customers who are currently in jobs that they're really not enjoying. And it spoke, spoke about really reaching out and doing something for them. It spoke about doing something that allows them to be creative, that allows them to build a life that they really love and all of those things that you get to do when you become a nail tech. Okay, so here are what I would look at when I am analyzing how well this email did. And I'm going to literally do it live with you now as if I'm analyzing this with my team. Okay, so we sent out this email. There's more to life than this. That was the subject line. Now the subject line is important because it feed into this and this is the first number that you want to look at. So this number is how many people opened your email. It's called your open rate. And in this particular email, out of 71 people that were on our wait list, 42.25% of those people open the email. So that's nearly 50%, which actually is a really, really high open rate. Now, why do we think this was opened by so many people? Well, at this stage, it could either be the time that it was sent, which I always send my emails at exactly the same time, 7:00am in the morning, because that is when our emails are open the most. This is something you can try also. You can do like 7am, maybe midday, maybe an evening, and then see what works best with your audience. Or you could align it to your social media and when that gets best, engagement and things like that. But we always do 7am so realistically, I don't think this is the time. And because not all of our emails are opened at 42%, but the rest of our emails or most of them are sent at 7am so that's telling me, I don't think it was the time. And because then all of our emails would have 42.5%. So the only other thing that it could be is that the subject line was really engaging. And I think that that's likely the case because it sounds more like a text message to a friend. It's a bit of a hook. It's got a dot, dot, dot at the end and it kind of leaves you on a cliffhanger. So it's like there's more to life than this. It's quite emotive. It draws you in straight away. It makes you want to click on it to understand, like more to life than what? Like what? What else is there? So I feel like it is likely the subject line. So if you notice that your open rates are higher some days lower some days look at the subject lines. What was that first line at the top of the email? Did we entice them to actually open the email? So things like, you know, exclusive offer inside, they don't always work. But if we said something like, oh my God, have you seen this? Then maybe that's more likely to work. Okay, so you want to just understand what is your customers most likely to open based on the emails you've sent so far? I've had some emails go out that have had an open rate of like 5%. That doesn't tell me that I've failed or that I should stop doing this. It just tells me that that subject line or that time of day that I sent out the email or the day. So maybe it was like, I don't know, a Saturday when everyone's busy or a Friday night when people are out or stuff like that doesn't work for my audience. All I know is that next time I sen an email I don't do that or I don't use that subject line or try a different date and time and things like that. Remember, you're going to be marketing your business forever. So if the rates are low, it doesn't matter. The next thing you want to look at is your click rate. So how many people actually clicked the links on your email? So maybe you put your booking link on there or your purchase link if it's a course or something like that. So whatever your percentage rate is of people who clicked. So out of 42% of people that opened and read that email, only 2% of them clicked. I would hope it would be at least 5 to 10% after at this point. So I actually feel like this is a little bit low. So what I would be looking at now in this email was where was the link? Was it near the top of the email or was it at the very bottom of the email when people were less likely to see it? Was it a hyperlink text that looks a little bit like this where it shows up in blue and makes you want to click it? Or was it a button? So maybe my customers are more likely to click an actual email button, you know, whereas like a box around than what they are to a hyperlink or vice versa. Maybe I should test this on my next emails and see if it has a difference with the CL rate. What was the copy like inside the email like? Was it a motive? Or actually was the subject line copy really good when they opened? It was a bit of a flat email. It wasn't really that good. Or did we only have one link in this? Should I have included the link a number of times throughout the email as different touch points for that customer? So these are all things that you can potentially look at to see what you can amend next time to see if the percentage goes up or down. Then you've got your bounce rate. So how many people just clicked off straight away and also how much revenue you made from this email, if you've linked it to your payment system or your website at this time, this wasn't linked to our website. So I don't actually have the data of how many people actually purchased our course off the back of 2% of people who clicked on the link. However, I have all of this data to help me with my next launches, with my next emails, to know and understand what my customers are doing, what their behavior is like when it comes to me sending them emails. This is how detailed I get with my emails. Okay, I don't want this to put you off, but I just want to show you I've been doing this for over a decade now, so I am a lot more experienced in using emails now. So what I do is things like this. So after a launch, I have all of my emails from that launch period put into a table like this and I will read them based on the open rate and based on the click rate. Okay, so you'll see that this is in order based on the highest click rate and then it goes lower as we get further down the list. So I'm interested in reason what all of these emails are during my launch periods because they were clicked in, clicked into a lot more than what any of my other emails were. So these were seemingly more successful than these. And also it's interesting that the open rates kind of correlate with the click rates. So the higher the open rate, the higher the click rate in a lot of them. That's because the more people that open the email, the more people are likely to click on the link. So maybe you don't need to be as detailed as this when it comes to day to day emails or standard nature sequences. When it comes to launches, you can definitely grab all of those emails and put them in the one place to understand what was effective and what wasn't. I hope that this was helpful. That's from the next masterclass, so I won't go any further on this. I hope this was helpful in terms of analyzing your data and really understanding what the numbers mean. It's really exciting. It doesn't mean you're doing something bad. If numbers are low, it means you've got opportunity within your emails. It's just about then finding that opportunity. So good luck. I hope this helped.