Dr. Nazdane Yarmadi presents findings on pre-insulated pipe degradation, showing adhesion loss plateaus rather than following predictable decay patterns, which challenges current extrapolation methods. Mark Spurr covers 20 case studies on integrating renewables and waste heat, stressing the need to match resource temperatures to system design and use year-round modeling.
Chapters
Good to see you. Thank you for coming along to this extra session, as it were, from the symposium which is devoted to the so called end of annex seminar of our IEA District Meeting Group which I'll explain.
First of all Then what is IEADHC? IEA stands for International Energy Agency. This was established in 1974 in response to the energy crisis at that time and works to ensure reliable, affordable and clean energy.
As a result of that, a number of these so called implementing agreements were set up for energy efficient technologies of which District Heating and Cooling is of course one.
And this aims to improve the design, performance and operation of district heating schemes. And we have nine current member Canada, Denmark, Finland, Germany, Korea, Norway, Sweden, UK and usa.
This implementing agreement is 30 years old and a little bit of digging into the history with the assistance of colleagues within our group revealed that there was a meeting in Stockholm in October 1983 as a result of which this implementing agreement was established and the first so called annex appeared and commenced in 1984. Each of these annexes comprises a group of projects lasting three years and we're at the completion of Annex 10. This is the end of Annex seminar for Annex 10, 10 times 3, 30 years. So the significance of that I think is there's an awful lot of material on a lot of topics that suddenly I look upon it as a kind of library or growing encyclopedia of district heating projects and research which you are free to look at on our website.
So what exactly is it that we do? We carry out research projects on all aspects of district heating and cooling technology focusing on reducing cost and improving performance. So type materials, installation techniques, system optimization, proactive maintenance, thermal storage, integration of renewables, to name a few.
There's something like an 8020 split between technical and policy focused projects and the policy bit is primarily because we actually do have an influential voice by operating under the auspices of this international energy agency that is connected into Energy Ministerial and gives us a good policy poisoning influence. I mentioned our website where you can find the research reports there it's in.
So if you haven't seen that, please feel free to look. And if you have been there before, there's another reason to keep tabs on it because shortly we will have these Annex 10 reports that we're going to hear about today. Full reports will be up there soon.
I think it's exciting times for District meeting. Sadly I wasn't able to attend the symposium itself, but I heard what an amazing event it was and I think this is kind of reflected right across the different influencing bodies that exist so that, for example, there is recognition at the IEA Secretariat, this thing called the CHP and DHC collaborative taking place.
You might think that that is kind of an automatic thing, that because we operate within or under the umbrella of the iea, that the Secretariat would automatically represent us. But in actual fact, it is a relatively recent.
Thing that they have strongly taken notice of our messages.
As well. At the European Commission, if we go back 10 years, there was really nearly nothing, to my knowledge anyway, on District meeting, and now there is extensive project work going on. The other day somebody sent me this information about an initiative at United nations level, District energy in cities, unlocking the full potential of energy efficiency and renewable energy.
Then coming regionally. I did a little bit of Googling and I hope it's accurate about the city we're in, found that it aims to be a climate neutral city by 2050. And the notes that were against that were sort of talking about it were stressing most notably that 80% of buildings already on District. And then if I can come back to my own country, I can say that as a very embryonic market, the UK has established a heat networks delivery unit within one of the government departments and is funding feasibility work in more than 50,000 cities. So there's an awful lot going on and it's really. The whole thing, I think, has really gathered a lot of momentum in the last few years.
But I think that there are also big challenges, which I contend is where the international research comes in. All the markets are in slightly different places and the technologies, I think, need to be shared and applied to different situations.
I think awareness is improving. Of course, I'm talking most strongly about my own country, but I think that I sense.
Some of the moves from other countries through the international collaborations. So awareness improving, but the effort's still needed on that. There's also this whole thing about buildings progressively becoming more energy efficient, so there's a diminishing heat demand. I guess if you're actually in the direct district heating business, you could in one sense be disappointed, but your sales might be going down. But I think actually that the future is strongly in the way of provision of an overall community solution. And I actually think that much of the distributing industry actually does recognise that, but I think it's an ongoing challenge.
Then there's the whole thing of reducing temperature supply. Some of these things will come out in the projects you're going to hear about.
And so reducing the temperature supply lowers heat loss, increases efficiency and I think very tellingly opens up more potential for the use of renewables and locally available surplus energy.
I think I feel that we're going to be moving towards quite a lot of integration of the infrastructures that our future sustainable cities are going to see integrated infrastructure increasingly with smart controls and smart systems evolving. I think that will be a strong challenge. And of course how do we actually.
See increasing penetration particularly in the countries where there isn't much at the moment, but where there is a high level of urbanization. What should be the business models that can support the district heating model going forward given that it's extremely capital intensive at the beginning?
So yeah, I mean the challenge is I suppose you know what we're here for. So a word about the projects that we have run under Annex 10.
And because you're going to hear from the project managers themselves, I'm not going to attempt to tell you what their projects were about. I'm simply going to pick out the things that are in bold. So you can see see the arenas that we have been operating in within our group. So low temperature disreputing which I mentioned, integrating of renewables and waste heat, I think there's a strong link between the two. And then of course coming to something very relevant to the district heating industry directly improving maintenance strategies, becoming more increasingly proactive rather than reactive. And also then very importantly is that we represent what are the actual savings that you can get from district meetings. So the calculation tool primary energy factors. The projects have all now concluded. The final reports are shortly to be available on our website. There are a few copies, hard copies that have been made up that you may have seen lurking on a table just outside here.
So feel free to help yourselves to those although there isn't enough for everybody to take each one. But as I say there will be a available shortly.
One or two brochures there as well about the program. This one about Annex 10. We will be not surprisingly going on to another annex and I would like also to mention this initiative which is a so called task share. Without going to much into the mechanisms of how IEA projects work, this one is a longer acting project area which is still open to.
Participate in.
I saw Dietrich. Dietrich, do you just indicate there's Dietrich. Dietrich is the operating agent for this project project which I see building on some of the work we've done within the Annex 10 projects. Most specifically the one on fourth generation systems that top one. So with task sharing, if you are undertaking research in the area for example, you can join in with like minded people, people from other countries and form Collaborative research in that way.
Moving on to our Annex 11 of operating in our usual way of competitively tendered projects, we identified these main topics as being ones that we felt needed to be be addressed. So looking again at cost reduction, looking again at transformations from high to low temperature distributing, and also very importantly looking at the whole resource planning, business development area.
Out of those we have these projects which we are in the process of contracting and we hope that we will be running all four of these.
So there is the transformation roadmap for high to low temperature distributed systems, reducing greenhouse gas emissions and energy consumption by optimizing urban form.
I mentioned smart elements being very important, smart use of the Nissan link and the government's models and strategic decision making processes. So those please just keep your eye on the website again for views of how those are progressing. As I say, we hope to be moving forward with all of those throughout the next three year period.
So if you want to find out more about the program, the brochure actually has details of who the committee members, executive committee members are in each of the member countries.
And also.
Just thinking right at the beginning I did say I felt a little bit like one of those kind of kids at corporate Christmas who puts a kind of thing on their head and it has like reindeer antlers on it and putting this on, I felt a bit like that and I completely forgot to introduce myself, but that is me there. So please feel free to contact me or indeed our operating agent, Andre Jens from rgf. They also.
Putter from RGFA is here. Heiko, just indicate yourself. And there are also a number of executive committee members I can see in the room. And would you mind just giving us away Mexico members. So if anybody wants to talk to anybody about our program, generally any of those folks, not just me.
My primary purpose here was really to introduce the projects themselves. I hope I've just given you a little bit of a flavour of what and why we do under the IEA program. But I would like now really without further ado, to introduce the first speaker on the first of those projects under Annex 10. So I'm very pleased pleased to introduce Dr. Nazdane Yarmadi from SP Technical Research Institute to talk about the Maintenance Strategies project.
It.
Just to explain we are recording these sessions because with nine countries right across the globe, it's kind of impossible for all the interested parties to actually come to our end of Annex seminar. So just a way of trying to be inclusive about how we tell people, particularly within our member countries about what we're doing.
Good morning, ladies and gentlemen. My name is Naz Banayaramadi and I'm from Estee Technical Research Institute of Sweden.
ST is located here in the west part of Sweden and about 60km from garden. And ST has also.
Some facilities in different parts of Switzerland and last year even in Copenhagen. And.
This is the headquarter of sdf.
The project that I will present some result from called improved maintenance strategy for instant heating pipeline.
And this is this project financed partially by IEA and partially by sc. And it's performed at Structure and studies Mechanics department at sc.
The partner in this project there were KTHC from South Korea, Sadcraft from Norway and IMA from Germany.
This slide shows your activities during the project.
We start the project with KIKA mapping and also then.
We had a project group that we choose the method for obtaining technical properties of pipes. We are.
Developing finally from log store pipes new pipes and we set up their maps experiment.
Experiment setting and we had after device a first expert group meeting and we analyzed the result from accelerated aging of new pipes and we parallel sketched a model for use. The result in this and afterwards we had an expected meeting number two in Gothenburg and we presented some results and discussed the result.
After that we got pipe which was in operation.
In Korea and Norway from two different network and we studied round us them investigate them and.
We try to correlate result from accelerated aging and those types from operation with the commands all the time and reporting. Had very good contact with IDA and.
After.
Disseminate the results and now I'm here and.
Okay. What was the aim of the project? The aim of the project is to establish facts and codes in order to predict future technical status of the pre insulated bounded distributed pipes.
And we started with.
Assumption some assumptions which based on earlier work than the existing standard and result of our experiments.
In this project, the creation of mechanical properties of the pipes is measured by the loss of addition between the polyurethane insulation and service pipe.
We try to answer how a component of district heating distribution system determined with time.
And use the result to create a model for improved maintenance strategy related to adhesion and cost of heat losses.
I would like to say some more words about background and assumption.
According to literature and earlier work, there is a hypothesis that the degradation of polyurethane is caused by thermoxidative reaction due to oxygen solution through polyethylene casein.
We had a previous project at ST that we are also worked with a method as an alternative method for measuring of the loss of adhesion between insulation and service pipe.
There is also a standard.
Excuse me, There is a standard according to EN253. That the measuring of shoe standards performed by using tangential and axial method. And there is some criteria. For example, for axial method is 0.12 MPa for shear strength.
This was the assumption that we are trying to use in our project. Okay, what are we dealing with? We want to do some experiment work. Will.
Simulate the natural aging by using of accelerated thermal and thermal oscillating aging. And.
We have.
Pipes from operation which will be evaluated in the same method. As we evaluate.
The accelerated new pipe. And with those we try to find some activation energy by using Arrhenius relationship. And can predict an extra plate to the future. And.
Use our model to see how it can be predict and technical status for the pipe.
This is our experimental work. I can show you here the chamber. When we measured financial shear strength in this pipe.
In the chamber.
In this part, we will try to verify the thermal oxidation theory. And finding a correlation between accelerated natural age pipe.
We did. Or accelerated aging by using.
Maximum oxygen diffusion. I will talk later about this. And we got pipe from our partner which was H1 up to 30 years old. From these two distinct heating network. And evaluate them and find this curvature.
This is again our heat chamber.
And the pipe size was EN50,160. And we have two different casing thickness.
The black one is the normal 3 millimeter casing. And the light one is 0.3 13 millimeter thin polyethylene casing.
These pipes are aged by electricity. And they are exposed to 130, 140 and 150 degrees inside. And the chamber ambient temperature was 70 degrees. At the same time, we have the pipe that you cannot see in this picture. This is this part of the chamber. And they are not connected to heating inside. They are just placed and exposure inside and outside to 70 degrees.
And also we have pipe in.
Controlled climate 23 plus minus 2 degree. Another chamber as reference pipes.
We tried to see.
When we decreased the thickness and give the oxygen a chance by.
Increasing diffusion rate 20 times here and 13 times. When we increase the ambient temperature from the ground temperature that normally is about 10 degrees up to 70 degrees. We each pipe and take out them in different times. In order to evaluate the shield strength up to 350 days.
Okay. This is the first result from accelerated aging pipes. New pipes. The Y axis. Thank you very much. In Y axis you can see the shear strength in megapascal. And the X axis is aging time in days.
No? So.
This point is.
The shear stain result from reference types, which is unaged. And the result from aging at 70 degrees. You can see the decreasing at the first part and then flat out. And you get the plateau in the curve.
This is for 70 degrees, 130, 140 and 150 each side.
And you can see that the shear strength decreases fast at the beginning and then reaches a constant value. It depends on temperature and buffer time.
Okay, Here is the result when we compare the 3 millimeter and 0.13 millimeter casing. And we measure the shear strength versus aging time. And we can see that in the red.
Points.
You can see the result for 113 degree degrees from evaluated by Tanya Shear method. And 130 degrees for open 13 millimeter also evaluated by a Gantesher shield method. And the same behavior. You can see regardless of diffusion of oxygen. And no significant difference between the 3 millimeter and 0.2 13 millimeter. For mechanical strength.
We saw another indication.
What happened in the pipe.
Here you can see the pipe with thin casing when is.
Aged at 140 and 150.
That they are just lost their adhesion and we got a gap and they couldn't.
And therefore we replace them with pipe that we wrapped 1 millimeter.
Steel wire around them with 50 millimeter space in order to give them the same stiffness as a polyethylene with casing of 3 millimeter. And then we age them again and evaluate them. And we get the same behavior as the thick.
Casing.
We also control the temperature because we had the electricity heating how temperature profile was along the pipe. And try to use just.
Samples that actually get the right temperature.
Here you can see a comparison between the tangential shape test according standard and the Estep plug test method that we are developing. Because s plug test method is very useful and very easy to use this in film. And we will see if we can get the same.
Behavior for the pipes. And we got the same. You can see here.
For 3 millimeter casing, normal casing and different method. And the result we got our test method. But we had some correlation that we are calculated at the last of this project. Yes, this is the best method that we used to. And this is the correlation that we got.
You can see the sample taken from pipes for unaged and aged pipes. And we cannot see even discoloration so significantly that is degraded for you.
This is the evaluation of shear strength for the pipe from operation in Korea and Norway. For supply pipe which had almost 150 plus minus 5 degrees. Again shear stage versus aging time. But this time is years.
And you can see from one year up to 38.
And this pipe is from different types and different types of polyurethane blowing agent. And regardless of type of polyurethane and blowing agent, the shear strength is not varied more than from 0.6 to 0.65 to 0.48. And if we can compare them with accelerated ageing path that we had for one year at 130 degrees, which is the nearest temperature to this temperature. So we can see the point after one year. So we have the same range.
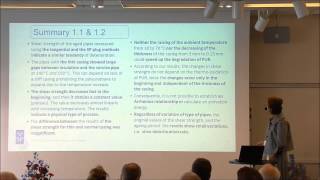
Okay, it's very summary of this point. This is the actually summarized that I said that the time ratio and Estes methods indicate a similar tendency. And the thin casing shows larger gaps between insulation and service type at 40 and 150 degrees.
And the shear strength decreases fast in the beginning. And it obtains the constant value.
For our temperature. And this is indicate physical type of process. I will talk about it a little more. How much have I done?
Okay.
The difference between the result for shear sensation for thin and normal casing was insignificant. Neither the rising of ambient temperature nor the decreasing of the thickness speed up the degradation of polyurethane.
Changes occur. According to our result, the changes in shear strength do not depend on thermo oxidation of polyurethane. Since the changes occur only in the beginning and independent of the thickness of casing. Consequently, I will emphasize that it is not possible to establish an Arrhenius relationship or calculated an activation energy that standard.
Postulate. And.
Regardless of variation of type of pipes, the original values of the shoe strength and the aging period. The result shows small variation.
Okay, we have intense to sketching model and model for improved maintenance. We are sketching model and.
We have.
We saw that we have all these boxes. But the input data from our experiments and evaluation of the pipes that we got from.
Operation cannot give us the input for Arrhenius relationship and extrapolation to get future technical status.
But.
If I can show you here. This is the Arrhenius typical Arrhenius relationship. When you have changing in properties and you have critical value that for example, according to Standard should be 0.12 for Axial. And.
When you change, when the material change and the properties change, you get an induction time and then.
Changing increase. This is the rating control step. And this is the saturated phase that you have. You are already lose the technical properties of your product.
But in our case.
The behavior was like this.
We have just get a Drop and beginning and then we get a plateau. This is a typical physical process when it reaches equilibrium.
But we try to see how we can use our model. If Arrhenius.
Was correct.
We have.
We haven't any activation energy. This is from literature and this is also from standard. If you couldn't have calculated activation energy. So we could find here and use the criteria and using Arrhenius sample and calculate it and as many people do at this time according to standard they calculate, they get some numbers and they.
Get this as their base for their decision. But I don't know how we can trust it. The future can show it. The conclusion of our work is that we can use Esper plug method in the field for measuring the shear strength. And this is the reliable as like a financial test method. And the character of changing in properties mechanical properties of. This is physical. And we cannot use Arrhenius relationship. And we need to do more work in order to elaborate model that reflects the observed behavior. And I will thank you there people that helped me in this work and IEA log store PDHC staffcraft, IMA and this symposium that allowed me to present my results. And thank you for your attention.
Thanks very much for that fascinating insight.
I just think we do have time for one question if anybody has a burning question. Paul Wai. Yeah, thank you. Let's see.
Is that a close relationship between the shear stress and the diffusion rate? Because I saw the temperature influence the diffusion rate quite a lot. Sorry.
The thickness of the pe, this is.
3 millimeter and 0.12 millimeter is 23 times difference. Yeah, but actually the temperature influences the surface as much lighter than the thickness of similar.
Yeah, I had.
You see, we had also the temperature. You have ambient temperature 70 degrees instead of 10 degrees in order to see if temperature increase the diffusion rate of oxygen. And we couldn't see the differences.
Yeah, but the temperature actually influenced the shear stress quite larger than the thickness of the pe. Next slide.
This is.
This is not. This is from literature. It's not my.
Excuse me, this is not my calculation. This is according to literature.
I have not investigated this.
Okay.
Yes, please.
Thank you for this interesting presentation. I have one question. For me, it's strange that you base this strategy of maintenance.
Avoiding forgetting that the weak points for the precipitated pipe are the joint. Did you consider this in the strategy for maintenance or. Or just the aging of the foam?
It's very correct that the lip foam is the joint. But.
We are very aware of this. But we had a goal for this project and the project is planned just for addition loss between the polyurethane and steel pipe. And we know that it is job and you know when you get lost the addition and you get movement for steel pipe this is the directly influence and impact on the joint and I think that is when joint gets formed then can water coming in. And when you have any connection between the polyurethane and steel pipe you get a very strong heat hydrolysis of the polyurethane and discoloration is coming from that.
One more question anyone.
In which case I'd like to thank you once again for your presentation and of course if you do have any subsequent questions then coffee break or a lunch, I'm sure Nazarene will be more than happy to answer. So thank you very much.
So I'd like to move on now to our second project under Annex 10 and to welcome Mark Spurr all the way from Minneapolis come here to tell us about the project Economic and Design Optimization in Integrated Renewable Energy and Waste Heat. So I think over to you Mark.
Robert and very, very interesting presentation. Nazi. Our project is quite a bit different in nature. Whereas the project you just heard about had a very.
Precise scientific scope, ours is much broader. I'd like to outline our presentation a bit and then get into it. I want to talk just briefly about what the scope of it was, the purpose of the report, what roles we saw this document playing, and then.
Talk a bit about the really most fundamental considerations. When we consider this broad question of how do we best integrate renewable energy and waste heat into district systems, what are some key things that we need to look at, those being I think obviously enough temperature and availability of the resource. And then we'll address very briefly questions relating to how to optimize these resources.
Then we'll provide our general recommendations for how to go about an assessment of such resources for a given district energy system and then comment briefly on some resource specific issues. There are some general issues, but there are also some things that are particular to the resource.
Over the years I've been involved in district energy and it has been to.
One of our enduring themes has been our purpose in life is taking of that energy that's out in our communities and making use of it, making productive use of it. So we thought that it would be a worthwhile enterprise in this annex to have a look at how best to integrate those resources.
We're looking at not only technical issues, but we're trying to evaluate how to how to compare the costs of different types of resources. And obviously when we make comparisons of costs. It's very tricky because we're making comparisons of costs with today's knowledge. We don't know what's going to happen in the future relative to prices, which makes decision making difficult. We also talk a bit about business issues and how some of the rate and contractual underpinnings of disability systems can affect what choices you make, and vice versa. We developed a number of case studies. I think we had a total of 20 case studies. The idea was to not only illustrate what's possible with these research, but also to try to highlight some key challenges for integrating them and to suggest solutions. One of the things that we were disappointed about in our work was we hoped to develop some very hard, comprehensive case study information about.
The cost, the technical performance and other aspects of these projects. We found it was very difficult to extract.
Really complete data from the sponsors.
This is an outline. I don't expect you to process this information, but I wanted to throw up the individual case studies and their relevance to of various resources.
Shown in red. And also with the importance of thermal energy storage as well as heating and cooling, I wanted to show their relevance for those. Just to give an idea of the types of resources and technologies that were illustrated in the case studies.
We thought it would be useful when we consider considered renewable and waste heat sources to categorize them. And so we came up with three.
Terms. One being high grade sources where the temperature of the resources is always higher than the temperature you need for your district system and thus can be dispatched and used whenever you want.
Then we categorized what we call low grade resources to be those that are sometimes, but not always sufficient for the supply temperature, but are always at least at the temperature of the return of the system. So in those times when the resource is lower than the supply that needs to be polished in some way, you need to bring in some other energy source in order to bring it up to your required temperature. And then we weren't aware that anybody had used this term before, but we came up with the term below grade resources in which the resource itself is always lower than the temperature you need. But those are resources that you need to upgrade with a heat pump. You could think of, for example, ground source as being an example of that.
When we look at the temperatures of resources, and these are illustrative and certainly not comprehensive.
It'S helpful as we consider their relationship to the relationship of the district system temperatures. And you'll see if I can get my pointer working. There we go. You'll see, for example, when we look at industrial waste heat, huge range of resources there. We were just trying to make a general range. And likewise with geothermal there can be a significant range in those temperatures. We also, for example, distinguished in solar depending on between a flat plate and evacuated tube. Evacuated tube, as we'll see later on, has a higher efficiency, but it also has a higher cost. So part of.
The approach in developing a plan for integrating resources is to figure out what's the lowest cost but efficient enough technology that I can use.
And then we also took a look at some heat sources from engines and flue gases.
For condensing. These.
Heat pump resources are shown. The actual temperature of the resources are shown in black. And the gray shows what wedge can do with an upgrade from the heat pump.
If we switch now from the temperature of the resource to the temperature of the heating system. We wanted to illustrate a range of possible practices. I realized that this looks possibly criminal to your European eyes, but that's the reality in, in too many systems in the US where we have very high pressure, high temperature steam being distributed. And part of our goal, quite frankly is.
Not only to assist in integrating renewable resources in waste heat. Here we're really trying to move North American systems down and.
You can see supply and return temperatures for high and lower temperature steam and then three different temperature regimes for hot water systems. What we're going to do now is just take a really quick look at how these three temperature, these four, five temperature schemes comport with the temperatures of the resources. But before we do that, it's important to also realize that we do have a temperature reset approach in most district systems. So this shows the supply and return temperatures for our hot water systems now, high, medium and low temperature. And it's important to illustrate this because when you look at the actual annual duration of those temperatures, although we might have a design temperature of 100ft for example, really most of the year the temperature is quite a bit lower. And so you need to be designing for.
What the preponderance of those hours would be.
We also took a look at what is is possible now in existing district heating systems. And this is Data from some 140 Swedish district heating systems with the supply and return temperature ranges. And you know, we have a kind of an evolution that's been occurring in recent years. But we're down now in some of these systems to some really quite low temperatures. And these are the systems that have greater opportunities to pick up renewable and waste heat resources.
So when we compare the resource temperatures to the temperature range shown in the Very light yellow here. For a high temperature steam system, we're largely missing a lot of opportunities. If we go down to a low pressure steam, like a 1 bar 15 psi steam system, we do pick up some opportunities. But then we go to what we term a hot water, high temperature hot water system. And these temperatures by the way are not the peak design, design condition, they're the average. Because as we discussed we want to be looking for those typical temperature conditions.
When we move to a medium temperature and low temperature scheme we see we're able to bring in a lot of resources that we weren't able to bring in otherwise. And when you're here, the energy it takes for a heat pump to produce this temperature is going to be less than if you're having to get all the way up to here.
One of the other key aspects beyond temperature is availability. I guess that's an obvious thing. Resources you need to be considering the resource availability pattern on a, on an hourly basis as well as a daily basis. And.
In some cases such as solar, the distribution of the resource is really often counter to when you most need it. So it becomes very important to use thermal storage in situations like that.
We took a look at not only some of the technical questions relating to industrial waste heat but also some of the business issues. And we'll get into that more in a bit.
But a truly solid understanding of availability pattern is pretty essential because there's no other way to really properly size. Well how much of that waste heat source or renewable source do you want to size for?
And as noted, thermal energy storage.
Has played an essential role in a number of these resources, including solar energy in particular, but many others as well. And in some cases that storage is going to be most effective if it's actually sized for a seasonal store.
The temperature, the trend is clear. I mean we're pushing here in Europe, we're pushing down in temperature.
In North America. We are from a very high level coming down.
It's important to understand that.
Lower is not always better because there's a balance to be achieved. If you, if you go too low you can make things rather expensive in the buildings. So one of the things that we have the luxury of doing when we're designing a new system is really and there are entirely new buildings being built is to truly optimize that investment in building size systems versus the kind of the knock on effects in the distribution system and the sources.
And has been discussed at some length in the past couple of days. There's some great work being done on low Temperature systems and the challenges that are bumped up against relativity. Janella the solutions have been put forward in that regard and we don't in this study try to rehash a lot of that.
And also in terms of the.
Supply temperature, we're trying whenever we can to use a polishing resource and really aim the general production at a very low temperature.
This chart attempts to put into one matrix both the temperature and the availability characteristics of the resources. So you have on the top dispatchable resources, but some of them are things you can burn that make it easy to dispatch at high temperature whenever required. Others that make may be a lower grade depending on the particular resource. And then geo exchange being a good example of a low grade steam. There are other resources that are really correlated with this critique mode. So for example, if you're recovering condensationally latent heat out of the flue gas.
If you're operating your boiler, you by definition have have load. And likely.
On the other side we have chiller heat recovery where you have a correlation in this case with the cooling load. So it becomes very important in the analysis to look at that overlap. Didn't really talk about deep water cooling or sewage heat recovery, but those are very site specific.
The temperature of the water for deep water cooling is going to be dependent on season and depth. So a thorough understanding of those specific patterns is essential. Sioux Chief recovery also very site specific in the sense that it's dependent on flows that have their own pattern and then intermittent resources, wind in the various solar resources.
Storage. This is a topic that is well known to all of us who work in this area. There are many good reasons that I won't belabor to use short term storage.
But more and more as we go deeper into use of renewable resources, in particular.
Seasonal storage becomes more critical. And in the report we look at a number of examples of seasonal storage, be it aquifer storage or borehole storage or in this case a very large tank being used in Germany in conjunction with a solar project.
In terms of.
Recommendations regarding both, I want to be I want to integrate more renewables and waste heat into my district energy system. What should I do? One of the first things that we recommend is really think through why you're doing this because there are often a mix of motivations.
Usually driven by environmental considerations, but sometimes driven by pr, by public relations. And some of the projects that we investigated, they were quite clear that, well, we did this because we thought that it would be a nice visibility thing and you need to be honest with yourself about why you're doing for what you're doing. In other cases.
They'Re being done because they're making a bet and it is a bet. And in the long term these costs will be.
Lower. And that is a dicey thing because nobody can predict the future. Last I checked.
In terms of modeling, it's pretty critical to do an 8760 our look at not only your loads, but also your resource. There's no other way to truly.
Size and design a system. But it's important not only to look at what the load is, but what the relevant temperatures are. And that, as we just discussed, can be different.
And in a number of the projects that we've worked on, we're looking at solar heat recovery, where we are integrating cooling. And then it becomes even trickier and more important to understand when those loads are simultaneous, when the heating and cooling load is simultaneous, or I'd say near simultaneous in the sense that with daily storage.
You can store some heat from the day produced in the night. Per minute.
Assessment of each resource. I'm not going to belabor.
This list. I think in most cases they're relatively obvious exercises. The one that I think I probably.
Talk a little bit about is long term potential for resource competition.
And this gets back to the predicting the future question. But clearly we are in a carbon constrained world. There's going to be more and more drive to use low carbon sources. And you have to ask the question, well, I've got some really low cost biomass energy right now. Great.
In 20 years, am I going to continue to buy that at a low price? There's no magic bullet here to answer that question, but it's a very important question to address. And the other thing that I think I'll mention one more in this list of the obvious and that is the maturity of the technology. We've seen some people move forward with technologies that really were not quite ready for prime time, as we'd say in the States. And so I think it's very important to really think hard about if you're doing it for the purpose of reliable energy, serious energy supply, you need to look hard at the majority of the technology.
One of the other things that gets a little bit tricky is if you are combining in many of the projects, many of the case studies that we examine are actually integrating multiple renewable or waste heat resources. And there's some really great strengths of that in terms of having flexibility and diversity of your energy portfolio. But it also is important to understand that to the extent that you are reducing your loads because you're deloading from using some waste heat source, you may need to ramp back some of your other resources that may get you into trouble. I think there are any number of cases where combining power plants have run into problems because the loads that they had previously supplied are now being supplied by other resources. So you just need to go into it with your eyes open.
We have seen particularly in the.
Markets where there's a very dynamic power market.
A real time hourly power market, that.
Predictive models that will.
Look at what's going to be the power load, what's going to be the power price, what's my thermal load, what's the cost of my thermal reflection sources is a pretty important.
Really essential thing for a multi resource district energy system and particularly one that is playing in an electric market, which many of us are. The other thing, the point I want to make too though, when I talk to people who have some pretty sophisticated.
Software that they use, they always make the point that ultimately this model is for human beings who make the decisions. And so it's not as if necessarily you can just say, oh well, the model's taking care of it, I'm going to go have a cigarette.
In some cases.
The presence of a human being makes all the difference in the world in really making the right decision. Usually that's when things are going wrong or in an unpredictable way.
And there's clearly, I mean there's very.
We have plenty of experience here with models for real time software simulation. So systems.
Just on a kind of business level.
When you're procuring a resource from outside.
And this is probably in the category of the obvious, but transparency is really important. I think it's very important to be very clear and open about what the costs of the resources are and what the consequences are of a loss of resource.
And also because temperature becomes more and more important for us as we integrate low carbon sources, it's very important that there be contractual.
Provisions relating to the temperature of the resource.
Customer contracts. Delta T.
Is a critical element to successive systems, particularly as they bump up against their long term capacity. And so, you know, different people have different opinions about this. My opinion is that it's very important for customer contracts to have terms that actually push the customer to provide a good return temperature.
And obviously if you're serving new buildings, it makes all the sense in the world to really work hard to work with them on the design of their systems.
This has been important anyway. It becomes even more important as we drive those temperatures down further.
Life cycle cost analysis again I Think you all are familiar with some of the trade offs that might be made.
Again, these become somewhat more critical when we're looking at low temperature resources because we do have, for example we can drive temperatures down.
That may require some additional cost in the buildings but it's going to save some costs. On the resource end.
All of the three key elements, the resources or plant, the distribution and the building side costs need to be looked at in an integrated way.
And then the other thing that I think is important.
To do your best on on is looking at the long term evolution of the scheme. And preferably you're taking a particular step with a renewable resource. But that's part of a longer term plan and you're accommodating or you're planning for the addition of other resources down the line.
So we're running tight on time. Right?
Okay. Okay.
All right.
So we'll. Okay, that's fine.
We'll run through this pretty quickly. But we have in the report we took a look at some of the.
Issues related to particular resources. Some of them are.
Peculiar to their own resource. I am probably going to just skip through these.
We talked about NIMBY last night and Anna introduced me to a new term which is nimby. Yes, in my backyard. So I like that.
I'm going to skip through this. On solar.
We took a look at. This is where it becomes very important to look hard at your temperatures and make some decisions about what temperature conditions you're going to be operating at. Because different types of these are flat plate collectors, different efficiencies, vertical axis versus temperatures, temperature difference.
On the horizontal axis. And you see we, we've outlined sort of the temperature ranges for the various schemes. It's important that you make a good match with what your temperature scheme is and also choice of technology. For example, evacuated tube versus.
Flat plate.
The.
Blue A is evacuated tube. A and B and C are flat plate.
You can see if you really do need to be at higher temperatures, you're better off spending the extra money on the evacuated tube. But that's another one of those cost benefit issues.
We did a very extensive case study for a solar installation in St. Paul. It's with a hot water system and.
I mentioned earlier that sometimes the restorer system's always present when you need it most. So here in this chart shows the results and I realize it's a lot of bars and colors and stuff but.
The.
On site solar use is shown.
This is the total.
Non solar heating. This first blue bar, the solar collection is in red and you can see it's in the summer, oddly enough. So in the wintertime when it's most needed, it's really relatively low. Just an illustration of a general point.
Heat pumps you need to consider again, temperatures are critical. The efficiency depends on the lift. And so you need to truly understand.
What your temperature regime is.
In a geo exchange type situation or really any this is illustrative for any lower temperature approach. This is showing the square feet which is in US unit square feet of building space.
And the.
Temperatures that the amount of space you can accommodate at a given supply temperature. So for example, this is 135again sorry about that. And you can supply a lot of that space at relatively low temperatures. But you need to look when you've got an existing space, you need to look very hard at the characteristics of the existing heating systems to determine what kind of record that, what temperature you want to operate the heat pumps at and the district heating system and correspondingly what kind of modifications you want to make in some of the buildings to allow them to operate at a lower temperature.
Better skip through this.
Yeah, there's some, I mean clearly there are some technical issues associated with recovery from gases. They can chew up pipe, you know better than anybody.
So that's it. Thank you.
Thanks very much, Mark. Sort of a huge amount of work across a wide range of supply technologies. I guess there must be a question somewhere.
Well, you make it very convenient for our time schedule because if we stop now we're right on schedule for our coffee break. But one last chance for no. Okay, so coffee break then of 20 minutes. Once again, thank you very much, Mark.
More from IEA
XIV-05: Flexibility and DH value chain (FlexVal) – advanced analysis & compatible pricing
XIV-04: RE-PEAK - How to cover peak loads in district heating networks with renewables.

Digitalisation of District Heating: Summary of findings from IEA DHC Annex TS4
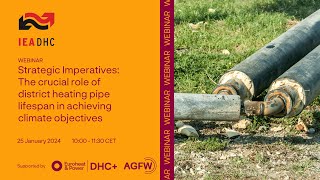
25/01/2024: The crucial role of district heating pipe lifespan in achieving climate objectives
IEA DHC XIII-03 Generation of simulated faulty datasets to ease heating network fault detection

XIII-01: Leave 2nd generation behind: Cost-effective solutions for small to large scale DH networks

XIII-04: Cost Benefit study on the building secondary network for improving DH performance
XIII-05: OPTiTRANS - Optimized transition towards low-temperature and low-carbon DH systems