XIV-04: RE-PEAK - How to cover peak loads in district heating networks with renewables.
The RE-PEAK project studies how district heating networks can handle peak demand using renewable energy. Researchers compared electric boilers, heat pumps, biomass, and thermal storage across different network types and surveyed 153 experts from 70 networks in early 2024.
Questions this video answers
November 2023.
March to June 2024.
163 responses received; 153 valid after cleaning.
70 from district heating networks; 83 from district heating experts.
Chapters
Perfect. Welcome. Thank you very much for having the opportunity to present our project Repeak here. Repeak is a project that we performed in the context of IADHC Annex 14 and the long title is how to cover peak heat loads in district heating networks with renewables.
Here is a short agenda for the next 25 minutes. I will start with a brief motivation and introduction to the project. Then Anna will talk about the options to decarbonize peak heat loads. And then I will be back again and present on the survey among district heating operators and district heating experts and what we found out there. Okay. For a brief introduction to the project.
We know that many district heating networks already have incorporated CO2 neutral alternatives. Nevertheless, especially when you talk about decarbonization, it always seems like the focus is especially on the baseload, while the rest is covered by gas. So we, we had more or less two hypotheses and one was that.
Addressing peak heat loads is a major challenge for district heating networks because on the one hand today they still primarily rely on fossil gas and oil, and on the other hand it is about peak heat load capacity, which means that it's not for a large quantity of heat that is prod, but on the other hand a large capacity that must be provided to really fulfill the heating requirements. And so Repeak aims to explore the status today on the one hand, and really derive what options are available for future peak heat load provision. So we have put up some hypotheses in the beginning and these are also derived from a previous project we have run and they found, so to say, their way into the proposal. And one hypothesis is that peak heat load lacks a precise definition that peak heat loads are currently mainly provided by fossil technologies. Net zero provision of peak heat loads is not yet in the focus of district heating networks and green gas is in the focus using the same technological basis. So green gas boilers. Then what did we do and what will you see?
The following methods and contents. We tried to analyze the definitions and the taxonomy of peak heat loads. We looked at the options to provide peak heat loads. That is what Anna will present, including the technical and economic feasibility. And then we identify the status of peak heat loads and expectations towards the transmission transition in direction of net zero from the survey that we performed. This is done by the BEST project team suited for that. And this is Energi Institute at Johannes Kepler University in Linz, Tallinn University of Technology, Taltech and Euro Heat and Power as a dissemination and promotion partner.
The project is funded by IEA DHC within this Annex 14 call for proposals and runs since November 2023 and should come to an end rather soon in the next month. And herewith I hand over to Anna, please.
Yes, thank you. I will share my continuation of presentation. Just a moment.
Yes.
Just a moment.
Do you see it now or you see my screen? You see teams.
We see the teams.
Okay.
Just a moment.
This way. You should see something. Yes, but I will look a little bit to another direction. Dear colleagues, I'm very glad to participate in this meeting and we'll continue with the presentation of results of our repeat project. And.
Our task as a partners were to develop taxonomy of peak heat load. And when we started to work with this topic with peak heat load of district heating, we understood and before we understand that actually this topic is not so simple and many complex and both definition and classification is needed to be analyzed. And that's why taxonomy as a method has been used to make this review, analysis and results of this taxonomy. Here you see a QR code which can be used and link which will be shared with presentation where you will get link to taxonomy in Kumu environment. And each of these taxonomy units can be. You can push on it and get more additional information.
Like description and references to get more information about it. But in briefly I will introduce taxonomy now. So we started with definitions and if you would speak with any district heating expert and ask what peak heat load means. So first that an expert will do will start drawing in air on paper. So for sure, one of possibility to define district heating is graphical definition. And here you can see examples for sure. Text definition as maximum heat demand during specific period. And another way of presenting what big heat load means is with mathematical approaches using equations.
So the main part of taxonomy is categorization or classification. And we use classification and categorization by two duration. So.
How long is time when peak heat load occur? When we have peak heat load in district heating network, it can be daily or seasonal peak heat load, how frequent peak heat load occurs.
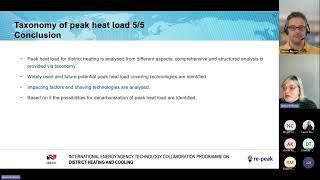
Another criteria for categorization is size of peak heat load. Both if we look on share of peak heat load in district heating system and another possibility to look on size of district heating network small, medium and large. And depending on need peak heat load profile can be different. And for sure profile form of profile for whole heat load duration curve for short influence peak heat load profile. And it is different depending on efficiency of energy efficiency, efficiency of district heating network and energy efficiency of consumers which are connected to this district heating network. So what we added to taxonomy was shaving technologies including demand site management Thermal energy storage and impacting factors and which for sure are related to forecasting of heat demand during all the year. But extremely extremely important when we analyze peak heat load and these can be found in our taxonomy and the main conclusion which is related to after we made this analysis using taxonomy of peak heat load that this district heating peak heat load has been analyzed from different site and we identified widely used technologies, mostly fossil fuel. As Simon mentioned, fossil fuel based peak heat load covering generation technologies and future potential technologies that can be used to cover peak heat load demand. And as I mentioned, impacting factors and shaving technologies have been analyzed.
And based on it the possibilities for decarbon some. I'm sorry, some equipment is moving here. Based on these the possibilities for decarbonization of peak heat load have been identified and about it in next slide. So there are main two options to decarbonize peak heat load. One of it which is discussed a lot it is peak heat load management including heat demand management and thermal energy storages, both low local and large scale thermal energy storages and synergy with individual heating solutions which are often now added to our consumers. And another one option to decarbonize and actually it was the focus of this project is optimization of peak heat load covering technologies. So from economical point of view, when it is okay.
To have lower capital costs but higher operation costs. Yes, comparing to base heat load current technologies when it is preferable that operation cost should be lower. And key parameters for technology selection are CO2 neutrality, fast start capability required size or area or volume or deepness if we speak or borehole and minimum heat load. For some technologies are critical. When we define determine suitable peak heat load covering technologies and the K technologies which have been analyzed during our projects are electric boilers, heat pumps and thermal energy storage technologies. And we used speaking about our.
Technical analysis. So based on categorization which I have mentioned before, we.
Made analysis for four types of district heating network peak heat loads. So it means that are groups by size large and small and temperature or energy efficient. So high temperature which is lower energy efficient district heating like existing traditional district heating network and low temperature more energy efficient district heating network. And for these four types of peak heat load we have made three scenarios when peak heat load is 10% of.
Maximum capacity, 20% and 40% and this here you can see these type of scenarios and we made the analysis for three technologies which I mentioned before. Electric boilers, heat pumps, biomass boilers. Biomass boilers? Yes, additionally sorry I didn't mention it yet, but we did it. And as a reference technology Gas boiler has been used. And the main indicators for comparing was energy saving and emission reduction.
And here you can see these four heat load curves. According these four scenarios for large scale high temperature, large scale low temperature, small scale high temperature and here sorry, mistake. And.
Large scale low temperature. And depending on this type of heat load curve and.
Percent of maximum heat demand, the main difference is peak heat load.
Hours when we have this peak heat load. And here you can see these hours what is difference in it. And according to performance evaluation, primary energy consumption.
From one side heat pumps show the best efficiency and lower CO2 emissions comparing with other technologies. But here you can see comparing according primary energy efficient and for different types of.
Scenarios. And speaking about economic evaluation. So like mostly used method as levelized cost of heat has been used. And fuel costs were analyzed were sourced from different European and regional data. And two types of peak heat load was assumed a little bit another approach. So for 10 megawatts and 100 megawatts capacity, based on survey data, which Simon will speak later and we didn't take into account here area and CO2 taxes.
And here you can see economic evaluation of feasible solutions or feasible options. But you can see that two types of graphs for each technology. And here we have wood chip boiler, sorry, wood chip boiler, wood pellet boiler, heat pump, electric boiler and gas boiler, but with green hydrogen. But here data for investment, which are the most important for this case have been taken from Danish Energy Agency catalog and from Austrian catalog of energy technologies. And you can see here. So here is presented for three.
Types of length when three types of time when peak heat load occur when it's.
50 hours, it means that.
We have a 10 megawatt situation and a 100 megawatt situation. And of course, if the LCO H are divided on a kind of thousand hours per year, the relevance of the capital costs per kilowatt hour is decreasing. And therefore the lower light area is the costs for the 15 hour 50 hour situation. And the upper other way around, vice versa, other way around, other way around. The 15 hour situation is the upper dark darker area. And the light area is.
Yes.
So when we have shorter, shorter time it means that it is extremely expensive.
Levelized cost of heat for biomass boiler and for wood pellets. But electric boilers and gas boilers is better solution for this time. But when we have longer time of.
Peak heat load, in this case biomass wood chips and biomass wood pellets are better solution. And heat heat pumps heat pumps have higher costs comparing with gas boiler and electric boiler for shorter time and Comparing with biomass wood chips and biomass wood pellets for longer time. So I'm sorry for inconvenience a little bit. Yes, because more on technic and a little bit less on economic. So thank you very much and please Simon, now you are back back with your presentation.
Yes, I share my slides again.
And you should see my slides again. Okay, I'm back. Perfect. Thank you. So part three is the results of the survey that we did among district heating operators and district heating networks experts. And here is the methods that we applied. So first we had an early version of the questionnaire which was.
Drastically refined based on the feedback from the experts in some feedback loops and also within the consortium. And we tried to reach two types of respondents. On the one hand we tried to reach district heating networks, which is an important differentiation because it's not operators. But if an operator operates more than one network, he or she was very welcome to answer the questions for different networks. And on the other hand we wanted to have the feedback from district heating experts.
And for both situations we used a mix of closed and open ended questions together. On the one hand, qualitative but also quantitative insights. We ran the survey in spring and so to say March to June, approximately 2024. It was an online survey promoted internationally, especially from dissemination partner Euro Heat and Power. And in total we received 163 responses. And after data cleaning we had 153 valid responses where 70 come from district heating operators and 83 come from district heating experts.
There is probably one important.
Limitation that needs to be mentioned, or two better two limitations that need to be mentioned. One is a limited statistical significance, so 70 responses is not too much. And especially when there are, so to say, some.
Responses that do not occur too often, like when there's waste incineration in three cases, something like that, the sample is probably not big enough to have a statistical significance. And another thing is that there was a high share of responses from smaller Austrian district heating operators.
Which I would approximate with approximately 20% of the responses. And that means that there could be a bias towards especially biomass and of course especially regarding boiler answers.
So here's some descriptive analysis and I think there are some insights that are really interesting for yes, statistical reference. If one would need that, we have district heating networks answers from a demand that starts with 600 megawatt hours per year up to 6,000 gigawatt hours per year. So a scaling of 10,000, the median network supply 65 gigawatt hours per year, we see that more or less all the district heating networks supply space heating and hot water, which is important to understand that it is the buildings and the behavior that impact the demand and not maybe some kind of baseload process heat demand.
We see that the minimum summer demand is approximately 10% of maximum winter demand, varying only a little around that value, and supply temperatures are approximately 100 degrees Celsius in the mean and average return temperature of 55 degrees Celsius in the mean. Again, be aware of maybe a small bias here by Austrian biomass networks. We especially see looking for example for the Danish responses that temperatures are lower than that. 60% of responding district heating networks have a central storage, and we see that the larger the network is, the more likely it is to have a storage.
More from IEA
XIV-05: Flexibility and DH value chain (FlexVal) – advanced analysis & compatible pricing

Digitalisation of District Heating: Summary of findings from IEA DHC Annex TS4
25/01/2024: The crucial role of district heating pipe lifespan in achieving climate objectives
IEA DHC XIII-03 Generation of simulated faulty datasets to ease heating network fault detection

XIII-01: Leave 2nd generation behind: Cost-effective solutions for small to large scale DH networks
XIII-04: Cost Benefit study on the building secondary network for improving DH performance
XIII-05: OPTiTRANS - Optimized transition towards low-temperature and low-carbon DH systems