TS3 / TS4: 2/3 - IEA DHC Workshop on Hybrid Energy Systems and Digitalization in DHC
IEA DHC workshop featuring Dietrich Schmidt, Julia Westervik, Milan Jungic, and Anna Kaled on digitalization in district heating systems. Presentations cover real projects, technical challenges, and solutions from utility companies and system providers working to modernize heating networks.
Chapters
Oops, sorry, some technical issues.
So now we are recording.
So let's start with the second block.
So the second block is about the digitalization of district heating system. What I mentioned before, may you drop in a little later. We had already first blocks this morning on the bigger picture, the political framework and the larger picture. Now we are going a little bit deeper into the activities here. This block is about the digitalization of district heating systems. Then we have a session later.
On Hybrid energy networks.
So this webinar is recorded. You will get what you will find the files later on the YouTube channel of IADH.
See?
And in the end we would like to make a group picture like we did. What's in the first block? Please remember this is a webinar. We are quite many participants for the moment we are about 62 participants here. This morning we had about 90. So we are close to. Close to 100 persons around here. So please mute your microphone when you're not speaking. So only one person speaks in the one time speaking. Since the chat function is not working for everybody, please use the teams function, raised your hand. Then we can see who wants to say something or to ask something. Please turn off your webcam when you're not speaking. So we just. We are saving bandwidth with so many participants and of course.
Keep the rules, the novel rules for these kind of conversations.
So the second block for introducing the second block on the digitalization of district heating. I start this block with giving a short introduction into the activity IADHCTS4, which is one of the projects which are organizing this activity here. Then we start with the first presenting presentation on the utility perspective, which will be quite interesting. The utility perspective on digitalization of district heating which will be given by Julia Westerwerk from Werme Humboldt from the local utility heat utility company in Hamburg in northern Germany. Thank you that you're here, Ms. Westerveck. I just saw you. The second presentation is about the digitalization solutions for heat infrastructure. Here we see the other picture, not from the use side, more from the system perspective, from the system provider perspective. This presentation is given by Milan Jungic from Danfoss company. And the third presentation will be about digitization potentials based on some ideas about the research facility we adjust building here in Frau iae, which will be given by one of my colleague, Anna Kallad from Fraule iae. And then we are going to close with an interactive session and in Q and A from all the presenters.
So what is TS4? So what is this project about? This project is a so called task shared annex project within the IADHE within the collaboration program for distribute heating and cooling. And here we we have a kind of subgroup, an international working group working especially on digitalization of district heating system where about 30 in every meeting we have about 30 participants coming together and discussing this issue about digitalization of district heating. So I think we all believe that more and more our future, especially our future energy system will be digital. So we are going to see more digitalization processes and more digitalization within the energy sector. And here we would like to discuss or with this activity we would like to give some kind of framework, some kind of guidance within within this with the perspective or in the field of district heating. So the project aims at promoting the opportunities for the integration of digital processes into district heating systems and to clarify the role within the different part here, especially for the item of operation operation operation.
Optimization and of course also for the for the question of maintenance, especially for this issue of district heating and cooling system. Furthermore, we would like to detach the implementation and of different digitalization structures. Here we would like to demonstrate the technology or show the demonstration. And second or thirdly we would like to take hand on especially new challenges which need to be tackled like we had already in the morning about data security, what about privacy, what about data ownership? All these issues need to be handled. Also when we are discussing the digitalization of district heating.
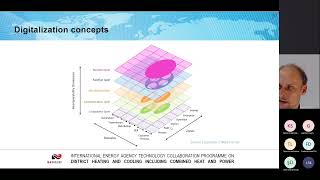
The goals of the so called TS4 project is to create awareness for this for the advantages for the implementation of digital processes for the various stakeholders and users. So what is the advantage of using digital digital method within the district heating system or within the district heating branch? We would like to provide the state of the art overview on the digitalization for district heating schemes from based on this knowledge, based on R D projects which are somehow participating or we are we have a lot of researchers participating in our agent, but not only from project, also from demonstrators and case studies. And third, we would like to evaluate non technical barriers and enablers for digitalization processes in district heating and cooling schemes. Here especially the topic of business models, legal aspects and policy instruments is of importance. Policy instruments we already heard in the morning the other things we are going to discuss also here in this action. So in terms of digitalization concept, this graph has been borrowed by some friends from the electricity field where we have a lot of or where we have much wider digitalization already done in the various fields, in the various stages.
Of.
The entire energy in the entire energy field. So here we see we have different zones, we have the Process and the field really from the from the machine from the component level or from the from the machine up to the to the market level here in the different zones. So we have the different domains from customer from the. From the end users back to the generation part. And here also in the different dimensions we see from the component level or the communication level back or let's say oryxin coming higher up until the business level. So we have different layers, different ways of where we can play or where we need to play with the digitalization issues here for our action or this entire picture would be much too big. So we focus on a smaller scale. So our three main aspects here in the TS4 project which we think is of main importance is the optimization of the real time operation as one topic for digitalization here we also include the idea of predictive maintenance of substations or pumps or other components within the system. That's the first focus area. The second is the increased efficiency in the planning procedures. So using digital method in terms of planning in terms of for expanding or for transformation of district heating scheme. And the second main aspect is implementation of new digital business models and business processes. And of course all these three components are interconnected. So these are the three main topics or main focus areas where we are working on. So we structured our work in so called subtasks. So we are starting with the end use because we are a strong believer in the that the end use or the efficiency in the end use is of major importance for the entire system. Also here digital methods are.
Offering quite large potential for optimization. Here we have a subgroup working on the digitalization of the end use and the consumption. We have a working group working on the digitalization of the infrastructure itself. Here also the idea of digital twins is of importance. So how to optimize and what to do with the infrastructure. Then in subtask C we are open up taking more this bird view higher level. So the digitalization on system perspective, how to optimize, how to analyze on a larger perspective and subtask D we are touching this issue about the business processes and business models and underlying all subtasks we have a kind of management within the annex in subtasky. Here we have also some additional aspects for the end consumer or for the consumption side. We also take into account the data collection and the monitoring issues in the infrastructure. What I already mentioned, the implementation of digital twin and simulation is of importance for the system perspective. For this group the analytics and optimization is a key issue. And for the subjasd for the Business processes. Also the case studies and legal aspects will be touched.
So we have collaborations to many, many other organizations working on similar fields like the German Heat and Power association, we have DHC or we have the Danish Board of District Heating. We have also a close contact to other IEA activities like the International Energy Agency activities on demand response of buildings in DHC network or also on data driven smart buildings. On the other hand, we have also connections to the Heat pump group within the IA on flexibility by implementation of heat pumps in multivector energy systems and thermal networks. So these are our connection points with other with other activities within iaa.
So first conclusions from what we can say from the first.
Time we are working together. So digital technologies are believed to make the whole energy system smarter, more efficient and reliable and boost the efficiency as well as the integration of more renewables into the system. So what we heard already in the morning, we need more digitalization to optimize our system on one end and to efficiently integrate more renewables into our system. In the future, digital applications might enable district heating system to fully optimize their potential and to optimize the operation and also empowering the end consumer. For wider integration of digital processes. We need to tackle some challenges like data security, privacy. So we need to come up with solutions. This morning we had some discussions what is ongoing on the European level here. And the key question is here how to find or not only to use the best, but digitalization also to come to real business models and to see the digital processes really in real market situation and in market ready services. And the strength of this project, the presented project here is the very close exchange between research participants and the industry participants. So we have a quite good exchange and we want to mirror it here in this presentations here in this activity here. So that was kind of first introduction into TS4 to the general level.
I could allow from the time one immediate question. Otherwise I would like to ask you maybe to.
Ask your question later in the interactive session, but if you have maybe one question about some general issues about this action.
Otherwise I would like to invite and to announce Dr. Julia Westervik, she is the functional manager for Business management in Birminghamburg, the local utility company in Hamburg, the city of Hamburg in northern Germany. And in Hamburg they are doing quite many activities on the digitalization. So Ms. Westerver, thanks that you're here and we are looking forward to your presentation and what you have to say from the utility perspective.
Yes, thank you for welcoming me and it's a pleasure to talk to you again. On this. On this option here. So I hope you can see soon my presentation.
Not yet.
Yes, it's preparing at least. Teams are saying that.
Perfect, thanks.
I can't see my slides, so let's. Give me a second.
Slides are not visible yet. I can confirm.
Okay, I share again.
Slides are preparing.
At least I can see your slide. But I think it's a presenter mode, what I'm seeing here.
It's okay, we just see the number of the slides.
Okay.
So do you. Do you see the first slide? The first slide. Perfect. That's what.
I don't see anything. I have to admit. I just see a black screen. Maybe that's on me.
Thank you. Black screen.
Yeah.
Okay.
Funny.
So if you can see a few not.
Yes.
Maybe you just start again.
Yes, I can start again because I'd like you to all see it.
Presentation is loading.
Do you see anything? I see at least your presentation mode again.
No, I don't know.
I don't see. I mean, no.
What's that? Yeah.
It possible that you send the slides to me?
Yes, I can send the slides to you, of course.
And then I just can.
Just. Then we have at least a second option.
So I sent you a copy.
It's 6 MB, so it shouldn't be that slow in sending.
I'm still waiting for your email to arrive.
Let me take some time. From Hamburg to middle of Germany.
I'm sorry for this delay, for this technical problems, but with all the different systems, sometimes these things happen.
Ah, I got it.
Finally.
Finally. One moment.
So I let you know which slide I'm talking to.
If you just.
I'd like to start with first. Of course.
That's great. That's great. So.
So hopefully everybody is able to see the slides.
I can see my slide.
Perfect. Hi Fuman.
Well done.
So, first slide. So just.
Yes. So thank you for the opportunity for me to let me share some insides from a heat supplier.
We are. I am from Heat Hamburg. Wehrma Hamburg. Next slide please. We are a communal partner of the city of Hamburg since more than 120 years. So we have been.
Yeah, we started supply in 1894 with town hall in the city center. This was the first building. Then.
We took a time to install different combustion units and also the grid. We are one of the biggest heating companies in Germany so far. So we have a grid with 845km and currently 12 generating units. My company has currently installed 1,800 megawatt and we're running this business around about. With 700 employees. So mainly Our customers are of course there, where the grid is so mean. We deliver in Hamburg, mainly for housing companies and also different.
Big industrial units with about 1100 contracts or transfer stations, let's say heat. Hamburg provides heat for more than 200520 residential units. I have a PowerPoint sign in the middle of my slide. Is it correct or is it just me?
Okay, Everything fine.
That's fine. Okay. So each household.
Will finally, when we have phase out coal, reduces each carbon footprint by 1 ton. Compared to nowadays usually used heating systems.
We don't deliver to all Hamburg households. But still today, in 2021, we deliver or we have a market share of around about 22% of the market. And as people are very satisfied with our comfort heat, there's a rising trend. And due to the energy change and the heat change demands in whole Germany, whole Europe, to reduce carbon footprints. Also for our products, we have made a plan last year how to phase out coal. And we will phase out coal in 2030. So then we have planned, we have built, we have installed and we are ready to use all the new plants and installations. This is really a tremendous change, a radical change in our philosophy this company, because the last decades.
We are used to run a plant.
Until. Yeah, whatever. And now we are forced to reduce.
Main things. So our new concept for this coal phaseout will be based on heat pumps, power to heat.
Insulations. Also we buy in heat. Usually we sell heat. In the future we buy heat from waste.
Companies, burning waste and as well as from the industry for off gas heat. And also we will start up a smaller combined heat and power plant on gas, but.
Not for payload issues. And also of course to switch for the fuels to hydrogen later on in a few decades. So we have.
A huge priority for these issues, how to phase coal.
The coal phase out. And also for another priority for my company currently or the last two years was less on digitalization, but.
For the digitization issues, of course we have a lot of competencies in house in the IT department, which is always a good.
Source of wisdom, let's say, for the applicants like me. But still the IT department is busy with other priorities still, if you remember, or a few of you, you may remember the history. We once have been owned by Wassenfahr in Sweden. Now we are owned by the city of Hamburg. So we changed ownership in 2019. And since then we also had to carve out all the IT applications, which more than 200 different applications on the Vattenfall IT systems to the Hamburg IT systems. So now we are Done with this since a huge time, but still this kept capacity is blocked from the IT department. And now we have another issue that we are the heat on Hamburg. We deliver heat of course, and soon we will deliver.
Much more carbon friendly heat. But still we have other.
Hamburg companies, let's say Hamburg, Hamburg Energy, let's say this is a local B2C supplier for gas contracts, for electricity contracts and also a few renewable energy heat.
Projects. And we will going to fuse with this company starting first of January next year. So in two months. So IT department says yeah, when we are finished with the carve out, then we carve in their system because their systems of framework energy is much smaller than us. So we are integrating all the IT systems. So my colleagues are busy on this issue. But in summer 22 their plan is to have done all that and then finally they have time for the digitization again.
So this is the IT department let's say on my company, but we have other projects still running. And this is what I'm going to show now. But imagine if you have a look on the next slide, for example.
I brought a few examples.
To show a few examples we're running currently.
I think we have a huge potential to speed up digitalization starting with summit 22 again. And in the meantime I share some examples what we're currently doing.
Two years ago I had the pleasure to talk to this auditory once before. And there I brought some slides for the smart meter rollout in Hamburg. So for each transfer station, which you can see here in the picture we installed finally we'd done all that since two, three years we took time to do that. We installed electricity supply in the cellars of our partners.
You don't see my mouse.
In the picture on the right, you can see in the right corner of the picture there's electricity demand. This is what we installed. And next door to that 2cm on the left you can see our gateway. So we rolled out all gateways, we finalized it, rollout phase is over.
With this smart meter what we installed there, we can collect many many data every 15 minutes, 24, 7 and all year long. And we can create then this infrastructure based on data. And we would like to cross link and automate the housing stations. Also we see an application for the billing issues that we can monitor and also place billing issues. And we have an online data management now for the operational data in the housings stations. And of course based on these huge amount of data we can step forward to use these data for all different issues. If it's the grid itself, how to steer it, how to optimize it. If it's the.
Customer point of view that we can talk on the phone easily. Well, I can have a look on your data in your cellar, on your home today, in real time. So this is really comfort for the customer if there's any trouble, for example. So we have the vision to integrate this real time data into management of the heat production, the delivery and the consumption. So this is the idea behind and we're done with the rollout for the hardware and we also, yeah, we used this data.
Already.
Next slide please.
We use the software from Samsung and here you got just an example with all the data we can collect, they are collected via a cloud. And then from there we have an example how it looks like you see on the picture on the right in blue, the blue lines, these are our heating, our heating grid. And there we have all the smart gateways sharing. So the circles mean if you have a number of 50 or 63 or whatever, which numbers are given how many housing stations or transfer stations there are. And if you zoom in, or if you would zoom in, but you cannot in the PowerPoint but in the system itself, then you can have a lot of more functionalities. So you can analyze data as much as you like and as much time you have, but usually you have a focus. So what we did, for example that we have a look at the return flow rates in our technical.
Parts. We bring heat at 90 or in the winter even more 90 degrees into the household and we would like and appreciate if the client is able to return 60 degrees. But of course the customer doesn't know and we do not want to check all the housing stations manuals. And now we see Every single one 24 7. And what we did is that we just had a look and started for the ones with the 90 degrees return, 80 degrees return 70 degrees turn. And then we contacted all the clients which delivered too high temperatures. If it's a problem on, on their side of the housing side and they have to change installations there or modify, let's say not change, but modify installations. And of course if it's only on us, then we do not have to bother the client and we can handle this on our own, but we can have a look. So this is really transparency that the operational units appreciate a lot.
So yeah, there are much more functionalities which you can analyze.
That's so far for this issue.
Next slide please.
With this data we collected, we also can have a look at other issues. What you see on the Last slide was the grid guys. And now we can have also a look on the clients perspective in a different way. Usually we as Heath Hamburg or Wermer Hamburg, we deliver in the cellar. And there we have a heat meter which sums up the whole building and not each.
Apartment.
Because this is not our market still. But there are many other companies which deliver smart meters and whatever technology in every.
Apartment to the end consumers. And we have a cooperation here with Lean Heat, a daughter from Dana first, which offers an IT and artificial intelligence.
Option. So we can share our data in the seller, which we provide online. But this case is not online. But still we have all the data we should supply. And Lean Heat takes the data from the heat meter inside the apartments.
So we have another point of view how to optimize and analyze. And the aim is here to save heat in terms that we have the aim to reduce the peak load. And if we have. Wait, what do I say? You can see here also first result in the graph on the left below the red dots is what is usually the case. And with the artificial intelligence and also all the insulation which are necessary in the apartments. And in each apartment you can optimize the transfer station, let's say. And you can see here the blue dotted.
Cloud is not the real word. So in the blue dotted line this is what you can achieve using this algorithm. So there's a minus 20% potential to reduce peak load. And this is proven in the buildings.
Which take part in this pilot project. So this is really a great result I think for us as a heat selling company, you sell less peak load on the contracts. That's.
Not sales friendly thing. But as it's more energy efficient you can sell this peak load of neighbor's house or whatever somewhere else in the grid. So it's not a loss. That's why we're pushing these kind of projects.
You can sell the same capacity to more people. Let's say next slide please.
We can also have other applications.
For the data we had shown from the Smart Meter here. Also the point of view from the customer perspective again, but more on the service providing issue. We had a custom Portal started in 2018. It's an agile project development via Scrum. For the methodology we had different phases due to Vattenfell IT and now city of Hamburg it. But this is not that important. But what we show soon. But don't slide to the next please. You can see soon what kind of functionalities we use and we build up. And there are many, many interfaces not only for the.
Smart meter. Data, but also to weather data and so on. And based on this customer portal we also established this year to key customers corporation. What kind of issues do the clients have? What would they like to see? Is it really the real time data? Most clients they say, well, I have my billing end of my year and that's fine, thanks. We don't have any issues in this, but there are also some optimizing their buildings and I expect sooner or later the customers will be very interested in our data we would be able to deliver. And also we are planning a pilot, a five customers pilot from the association of Housing Companies. Also to ask, well, we would like to improve our customer portal. Let's give us input, what would you like from a customer customers perspective. And also we can see not every client is online on our portal yet. But sooner or later they will all come to us, I'm sure. As we can see an increasing demand and registration.
The market reports that our portal is a front runner for customer centricity. And this is something I'd really like to share with you because we are not a company B2C and not a B2 to the end consumer which.
We are for the B2B client. So this is not common yet to have that many functionalities. Next slide please.
So you have a look on the right, a picture. If you log in as a client on our portal, you have of course many, many dashboards. But here you can see all your.
Housing stations. In this case our client has many stations, 95 stations. You have a map, you have a list.
You can see your billing, you can see of course a detailed view of your heat station and the seller. You can see your, your contracts, your phone numbers, of course, and also many, many other functionalities.
Could you please come to conclusions?
Yes, so next slide please.
Yeah, I think this is.
Yeah, you can read. Next slide please.
So here you can see all the interfaces for the billing, for the customer relationship management, also for the cloud data, for the weather data. So this is just a glance what we can see online 247 from the client's perspective. Next slide please.
Then also we have a house connection portal for the other companies in Hamburg for the gas grid, for the electricity grid under water. So this client also can ask via this channel to find, oh, I need.
A.
Heat contract as well. Next slide please.
And last project I'd like to share. This is also an augmented reality app tool which is on the mobile devices installed now for the sales people that they can go in the center, which you can see here on the right and the 3D data are currently provided by Danfoss. So this is a transfer station in the cellar, where there's no transfer station yet. So this is just augmented reality, what you can see. But for the client itself it helps a lot.
To get a visual idea how it will look like in its seller. So for the conclusion, let's say we have from the sales perspective, because I'm in sales, many issues I share. But of course we have many, many other issues which will be speed up in next summer, starting for Digital Twins or for many other issues. But this will be another hour to share with you.
Thank you. Thank you Ms. Westerwerk for this introduction and yeah, sorry for this technical problem. So I think I would like to group the questions later when we are discussing after in the end of the session. So. And from this perspective. Thank you Ms. Westerbeck. I would like to invite Milan to share his screen and to jump over from the. Or giving us the other perspective, the perspective of system providers.
Thank you, Dietrich. Let me try to share the screen and hopefully we have no issues this time.
Yes, I can see it as well.
Perfect.
Super. Okay, so thank you Dietrich and also thanks for this opportunity to be here today and to present actually some glimpse of what in terms of digital solutions we are developing in Danfoss. My name is Mila Nyungic, I'm coming from Danfoss Product portfolio and of course I will be doing this presentation today.
Very pleased actually to see the presentation from Ms. Westervek because it is kind of a confirmation also for us that we are developing the right things and that we are developing things in the right direction. Of course we as Danfoss come from the other side, as suppliers of products of solutions for utilities for end users. And I must say I'm very pleased also to see that Vermeer Hamburg is already using some of the modules from our linked solution which I will also be presenting today.
So let's go to the next slide. Dietrich, please inform me when I'm approximately at 10 minutes or something. So just to make sure that I'm not long. Okay, so how we in Danfoss actually see state of the art district energy system? Let me just. Sorry, I'll go back. Let me just move this one like this. Okay. How what is in our vision a state of the art district energy system? Of course it means that we are going from a single source to multi source systems, bringing in renewable energy, bringing in waste heat, surplus energy from industry sector coupling, utilizing heat storage and so on. It of course also Means that we are going from high temperatures to low temperatures to enable better efficiency of the systems. It means that we are going basically from one way system to bidirectional systems where we can exchange energy in multiple directions. And for this, of course, we also need positive or correct regulatory measures.
We know that in Europe our goal is to achieve 50% coverage of heating demand until 2050. To achieve this, we will need to build approximately around 22,000 district heating systems. And again, to achieve this, we need to build majority of them before 2035. So regulatory support here is basically a must have. Of course, on the other side, we need to respond to the changing market, to the changing customer structure, customer demands. We need to think about investments which are of course huge in building this kind of systems.
Now, as I think it was already indicated through Ms. Westerwerk's presentation, that basically more or less everything she spoke about was related to digitalization. And we see it very similar. Basically digitalizing the complete district energy system, basically from plants to homes, is the one thing that enables us to operate these systems in a more smarter, more efficient and more reliable way. Of course we need to do it in the right way. It means that when we talk about improving efficiency, about improving.
Production, optimizing production systems, optimizing the complete chain of a district energy system, we always need to start with the demand.
I think we cannot emphasize it enough and we need to repeat it constantly. Optimum primary network starts with the optimum secondary side. And in these terms we are also trying to develop our digital portfolio or digitalized solution to support this. Basically that we always follow the proper line. We start with optimization of the demand side, we continue with distribution, and then at the end we optimize the production. Of course it's not a one step thing. We need to do it basically constantly. So it needs digital technology that we can run it basically 365 through 7, the complete process. So how do we do it? Basically on the domain side we are trying to predict and optimize the demand side parameters.
And here.
We already saw in Ms. Westervak's presentation.
Schematic of our linked solution. What we can do is basically by using the artificial intelligence, collecting the indoor. Hope you can see my sensor, or I will put it as a laser, collecting the indoor sensor data, collecting the weather data, combining this with the dishwash heating data, we basically enable the short and long term demand prediction on a building as well as on a network level. We also enable different kind of algorithms for auto commissioning for running this system in more Self adaptive way. It means that we can optimize building heating parameters like secondary side supply temperature basically and kind of.
Constantly optimized heat curve. We can use this data from the building to optimize the distribution and production according to the needs of demand, to have a more demand responsive system. And we can also use the data.
From the heat consumption, the load curve, to basically optimize the peak footprint of the building by also using the thermal capacity of the building with of course the goal to shape, to shape the peak loads. And we can do that up to 20% according to the projects that we already.
Are doing.
Milan, five minutes left.
Okay, thank you. So this is basically the goal of the linked building. To basically make the load curve more in line and to cut off the peak shaving, but on the other side, also to provide the data that we need to efficiently run the primary side. And here when we talk about the distribution, we have a solution. It's called linked network. It's basically a thermo hydraulic modeling solution. It can be used in two ways.
When it's offline, it can be used to efficiently model district heating networks for reconstructions or new built district heating networks. When we connect it with the real time data, we can actually use it combined with a calibrated network model to actually simulate the network conditions basically in every millimeter of the network. Which allows us basically to evaluate a different kind of what if scenario and to prepare the most optimum distribution plans.
I will skip these two slides to make the time shorter. I basically explained this already on the first slide. And then of course the last part of this solution is the liheat production. And this is basically the module that allows us to optimize the production sources. And here we are mainly focusing on two things. One is to optimize the supply temperature for the network, meaning that we are moving from traditional way of running a production, running a system on a production curve based on an outside temperature. We are trying basically to be more proactive here. Based on the demand forecast, based on the transport times in the network, we are basically calculating the most optimum supply temperature for the network at any given time, thus ensuring that in average we are lowering the supply temperature and ensuring savings or lower network losses. On the other side, of course, we also need to optimize production sources in a way that in modern networks we have multiple production sources. The complexity is increasing. We are basically constantly in front of a question. What combination of production sources is at this given point in time most cost effective and technically feasible? And this is why we are again using the linked AI technology that is basically based on all the input data, from financial data to demand prediction to technical boundary conditions, trying to calculate as the most optimum combination of production sources as mentioned from technical point of view as well as from the cost effectiveness.
And by that basically we are trying to close this circle. Of course, to perform all of this we also need to collect the data. And here we are using our solution, Linked Monitor, which is a web based solution that allows utilities to connect buildings, network measurements, production sources. We are developing this solution fully customized for district energy, so it's much easier to implement compared to some other more industrial SCADA solutions.
At the end of the day our goal is that we are offering an end to end to end portfolio of basically solutions as mentioned, from the secondary to the primary site. Our goal is that basically these things.
Are.
Compatible, easy to integrate between themselves. But on the other side we are also building them on open protocols, so individual modules from this solution can be implemented also into the third party systems. Of course it's not everything only software layer. We are working also a lot on the.
Say intelligent solutions for the for the physical products like Titan algorithm which we are developing to.
Algorithm that will allow us to optimize the.
Control curve on the controller level for the each building or for each substation individually to perform predictive maintenance, to detect different kinds of things like hex scaling and so on. So really a lot, a lot going on too much to mention it. Everything today come to conclusions. Yes. And here we are.
That's it. Sorry for running really quickly through the presentation, but I hope I was clear enough and you were able to to catch the most important points. So thank you.
Thank you Milan and thank you for that you stepped in for Oskar Gutmansson who is ill for the moment. So thank you that you're with a short notice were able to step in here. So again I would like to discuss all the presentations in the interactive session. In the end. Thank you Milan. And now I would like to ask.
My colleague Anna Kallad to present our test facility, our ideas around the test facility.
So I hope sharing looks very good. Thank you. Perfect.
Everything working okay, I will quickly start with my presentation. Yes, thank you very much. My name is Anna Kaled, I'm head of Department of Thermal Energy Systems Technologies at Fraunhofer IE in Kassel. In the course of my presentation I would like to give you now a short introduction to the research project Urban transformation of the Urban District Heating supply which has started in February this year. The project Duration is about four years and the project is funded by Federal Ministry for Economic affairs and Energy, the consortium, as you can see here on my slides, consisting of partners from industry and research, DHC association, pipe manufacturer, company of heat supply, downforce, sector planners, universities and so on. Yeah. To give you a short impression of the project goals, the project goals are on the development and derivation of technical solutions for the transformation, decarbonization and the digitalization of district heating supply, taking into account volatile pressures and temperature, using renewable energy energies and waste heat sources. To realize the project goals, we have to derive the main key measurements and to develop and to verify new approaches by simulation and experimental investigations. Next to these approaches.
The amendment of regulation and guidelines will be examined. As a summary, we are working out a catalogue of measures to bring our findings findings from research to the practical world. To realize the project, the test facility district lab will be used as part of experimental investigations. Here we have a schematic diagram of our district lab. And with the help of this picture, I would like to give you a very short impression about the basic structure as well as the basic functionality. First, we see the flexible heating grid on a quarter scale. The grid serves for test implementation at various temperature levels, taking in into account different supply strategies. Secondly, we have a management system and control concept. This unit serves for the basic control of our laboratory, but also for the development of new operating strategies control concepts for flexible heating networks. That is of course, of greatest importance for digitalization. And this includes also the testing possibilities of several components like heat pump, pipes and walls. And last but not least, there's also a pipe test bench for mechanical tests of piping systems. And by the use of this test bench, it is possible to carry out real tests of pipes, components, different length techniques and bedding materials. Following by the very short introduction of the district lab, it has to be stated that this test facility, beyond the project Urban TURN, offers experimental and testing opportunities for network operators, energy suppliers, as well as system and component manufacturers of innovative district heating networks and of course, district heating applications. But let us now return to the project Urban turn. In the context of identification of challenges for the implementation of transformation strategies for existing networks, we are analyzing new requirements, obstacles, bottlenecks, potentials of the transformation, taking into account approaches of digitalization. As part of this work, existing design criteria are of course being scrutinized. Now, we are currently in the process of completing a first draft in which all the aspects will be summarized. Based on these analyses, it is also necessary for later software technical implementation and the experimental investigations. And at the district lab to define and parameterize a different test scenario. Here we have a first rough overview of the variance. That is all already available, but we have to go more into the detail as part of the next steps. As we've seen, the analysis of the previous shown work is the main basis for the software technical implementation at the district lab. And as part of the first step, the development and validation of a central control system as an interface for operating and regulating or control the test facility is foreseen. And this picture gives you first impression about how it will be work. And in the course of.
This work, the components of the test facility will be connected to hardware in the loop components. And these are then connected to an automation system that carries out central management and monitoring such as control. And the measurement data are then handed over onto the main management system and controllers. And the interface a central computer will then or central calculation unit so to say, then allows the experiments to be carried out. And in addition to the control system, a digital twin of the flexible heating grid and the pipe testion test section is created. And these are used to carry out and control the experiments. So we will program them and connect them to the district lab and then we will control it by the help of the district lab. And a first version of the digital twin of the flexible heating system or heating grid is available right now. And it's working well. But we have also put a lot of work on it to equip it that we can. That we can show or simulate some more temperature levels. The basic scheme of this digital twin of the flexible heating grid is shown here. And the last step for the development of the software based investigations of selected technologies is the preparation of a measuring point plan for the implementation of investigations at the district lab. To give you a short impression about the experimental investigations of the district lab test facilities, I will give here a short introduction of the main setting of the district lab represented by means of a CAD drawing. And you can see here the type pipe, dust, bench, the flexible heating grid, the hardware in the loop units and also the centralized heat sources that are acting as sinks, so to say. And as part of the investigations of the flexible heating grid that is given here in this red circle, focused on the investigations of different supply scenarios to identify possible critical operating variables for the examination of different supply scenarios with regard to their potentials, but also their obstacles. So everything has to be taken into account by carrying out these experimental investigations. And in order to meet our goal at the end and the next is on the investigations at the pipe test Bench, you can see it here in this red cycle again that are focused on the investigations on the interactions of pipeline and the soil under consideration of dynamic operating conditions. And also on the investigations of bedding reactions and also here under.
Settled conditions as well. And also the identification of new requirements or criteria for bedding materials and also for installation techniques have to be investigated. As part of this experimental investigation.
I start at the beginning of my presentation. The verification and also the extensions of design criteria for thermal grids with volatile fading are a central issue. And based on the findings of the experiments, development of a proposal for the extension of existing design criteria and the creation of a catalogue of measurements for network operators, energy suppliers, as said at the beginning, will be carried out. And to realize this working item we have of course to analyze and to describe the characteristics of the thermo hydraulic behavior, but also on the influence on the service life as well as the limit load capacity of the system components to come to a new design and evaluation criteria for future district heating supply solutions. Yeah, this was a very, very quick overview about our project.
Yeah, would be great to answer your questions.
Thank you, Anna.
So now I would like to invite all of you. Maybe also the other speakers could come up again or show your.
Picture again. And we already have the first question from Stephen.
Hello, back again. You hear me a goal, right, Dietrich? I'm just checking. Sorry. Can you hear me, Dietrich?
Yes, we can hear you.
Oh, that's fine. Sorry, sorry. We've had a lot of trouble with teams. I've been pushing combined heat and power as more efficient for 17 years. I make system operation GB. But one thing recently that came up with reciprocating engine CHP is that MAN have developed electro thermal energy storage which allows you to take heat from one level and put it at various different temperatures, including ice, including frozen. I just wondered if that was of any interest to the producers. Noting of course the test facility is designed to work at different temperature devices. It's ETS remea.
Thank you. Thank you, Stephen or Anna, you want to answer regarding this man.
Thank you, Stephen for this remark. And we are also having in mind testing also production facilities like larger heat pumps and so on.
Yes, that's true. I didn't get the question at all since I have bad problems with the audio. It has a bad signal. I don't know what it is. I'm really sorry for this.
So the question was about if we are considering this CHP unit from man, which Stephen mentioned.
Okay, sorry. Yes, but I agree.
I don't know.
Okay. Are there more direct questions or remarks to the presenters?
I think this session really showed very nicely from the question from the utility companies what is already done in Hamburg? Not all utilities company are so far as Hamburg. So thank you very much Mr. That you could share a little bit what you're doing in Hamburg. So we have seen a little bit.
What is possible from the system provider and we have also seen what might be under development or what we are having under development in research facilities and what we are thinking of. And now we got more questions from Thomas Link. Linkleader.
Yeah, hi together.
Can you hear me? Yes, perfect.
I have a question to Milan from Danforth. You mentioned in the beginning of your presentation that the bidirectionality will be one of the or is one of the big trends that will be will play a major role in future industry heating. Do you at Danfoss already offer like products like bi directional heat transfer stations or something like this that can be bought or is it still under development?
We already have the products. We already have quite several projects where we implemented them. Of course they are very custom made to specific systems so you wouldn't find them in any official price list or something similar. But if you have a requirement like this. Yes, we already have available solutions, so please just contact our local representatives and we can talk about potential technical solution and all the other aspects.
Okay, but did I get it right that these are like individual solutions and there's nothing in your product line, let's say at the moment?
Yeah, I mean all the projects that we have done until now were very specific for specific systems. So we have done quite a lot of them, but they are not kind of standard or pre assembled solutions. So we need to look into the requirements and then basically prepare.
A blueprint what we can offer and give you the technical description, the pricing and everything.
Okay, thank you very much.
Welcome. And I would like to ask Frederik Feike from Darmstadt.
Yes, hello.
Thanks.
I have a question to Julia. You said that you use the data from the metering devices to find the consumers with the highest return temperatures in your network and then to address their secondary heating side systems to reduce the network temperature.
Did you or how did you motivate the consumers to take part to engage in investments to improve their heating systems? Are there any benefits for the consumers if they lower the return temperatures?
Yeah, I think that the main benefit is that we have a contract with each client, of course, and we have this technical.
Brochure, Gab Technische Alstrossbindingungen which usually says which temperature Is defined as.
Return temperature. And usually we say you can bring home 60 degrees. So if there's a client bringing 70, 80 or even 90 degrees.
Then we have a technical issue there. Usually we first have a look on the data. It's on us. On the primary side, can we fix something, change something, install anything? We would do that immediately. But if it's on the secondary side, on the client side, of course there's no extra benefit for the client, because we have a contract saying please deliver 63 return.
So if the client is not able to change and reduce the temperature, then of course the sales contact will have talk. But usually.
We do not change our contracts. We usually don't.
Okay, thanks.
Are you working with motivational terrorists in Hamburg?
There are some utilities, especially in Denmark, working with this changing tariffs. If you have too high return temperatures and you have to pay more, if you have reduced temperatures, then you pay less. Have you considered this kind of ideas? What do you think about?
Of course we have considered this idea in the last decades. This was no topic because we were, let's say, blind. We can couldn't see what is return rate throughout the year. And if it's sometimes too high, it's more the peace you need in your customers.
Relationship that you say, well, you didn't bring.
The temperature you should, but it's fine with us. But now we can see and we analyze the whole year, so we can see if the client is sometimes too high or if it's all the time too high. And for the ones bringing.
The high temperature all the time, of course we are in discussion, but we have no benefits and we also have.
No pain for the client, let's say. But we consider it. But until now this was not our relationship to the client.
Okay, but anyhow, it's an interesting development. Frederick, you have one more question. You are first. Or is it an old question?
Sorry, no.
Then I would like to ask Hitte Smital.
Yes.
Hello everyone. My question is also to Yulia.
I would like to understand what kind of partnerships or cooperation you have with Smart Meter or software providing companies. Because I understand that this is not part of your business model, right? To sell meters with the energy at the end of day. So how this really works.
So we usually have.
A transfer station in the building.
There we.
Have the billing and also the delivery, of course. And for all the digital things now. So the installation for the smart meter we bought these.
Parts.
From a supplier, we installed it and we are using. So we apply on this installation. We don't sell them.
Okay.
Okay, so you act as a customer for smart.
We are customer of these.
Smart meter companies.
Yeah.
Okay, Maybe Milan could add a little bit at least there are some. Some components also from. From Tanfor.
Yeah, I mean it's. I think from utilities point of view, it's always a question of ownership of the substation at the end of the day and where is the limit between the utility and end users and how utility can actually.
Provide the transfer station, the heating station and which components to the end user. So who is basically investing into it? We have different models behind of course primary site. If we want to have efficient system, the minimum condition is that the primary side is fully in the control of utility. But by that also the primary hit meter which needs to be read out. Without this we don't have data to optimize the system. Basically secondary side is then a different story. I would say it's very hard to get in. But of course as mentioned, optimizing the whole system we need to look more deeper and deeper into the secondary side. So in the future these relations will definitely need to change and utilities will go more into the energy service company mode providing also energy management services for secondary side.
Thank you, Mina. Are there any more immediate questions?
No.
Then I would like to.
So at least these are the. Let's say main topic we are working in TS4 with. So we are also having this idea of what Milan just mentioned that the digitalization of the engines is some of the core and very important part because we need to reduce the return temperatures and also following reducing the supply temperature to somehow to get a chance to optimize the network and to optimize the production. So based on the somehow optimized end user we can work with the infrastructure side. We can see what we could do on the infrastructure side. Here we are using digital twins. What I mentioned before and of course what Milan also touched the idea on the system perspective. So how to come up with an optimized overall system? So then what is about the end use? What about the production side? And here we are of course the operational optimization we have to control. We are online, we have this concept but on the other hand we can also see this idea of doing analytics.
Running analytics and checking offline in larger steps how to optimize the entire system. And what we also touched here is a question who is earning the money?
Where.
Where's business concept behind especially checking the cost drivers for operation maintaining what? Just also Julia Westervik mentioned before they were applying without any digitalization it's very hard to check out what is wrong with some digital data or with data generated by digital measure, you can really see something. And then from there you can can come up maybe with some new ideas for your system on one end and also maybe trying to launch totally different ideas like this idea of motivational terrorists where you give some bonus if the temperatures are low, if the secondary side system is working very well and maybe doing the other side on the other hand. So we haven't touched this idea really there we get a new potential for business model. So a question also to you yet. Could you think about let's say totally new services like offering service in comfort, that you're somehow securing the comfort of.
Tenants in multifamily homes, that you really go a little deeper into this. Or maybe we could also think about security services.
Since you have a digital connection to Werma Humboldt. You could also see maybe what's happening in the building and then you can also offer some kind of security.
Service. Have you thought about that one?
We thought a lot about different services from really a sales perspective, not from the grid perspective, let's say. I think, and we think at Heath Hammerhead think that the market, the ownerships, the end consumers, they demand more service and they also demand more digital services.
If you for example, consider apps for the end consumer, the end consumer is not our client. We deliver heat for the owners of the buildings, for the housing companies, for industrial partners. So it's not the end consumer, but the end consumers. They would like to have an app for their home like smart Home with all different issues. So we can think about delivering data to the owner and the owner splits then with other smart home issues to deliver this data. This is something we considered, but there's no price tag on it. How to say. And also we think about different services that we.
We don't deliver only heat for the.
Heat meter in the cellar. So we for example, more the technical services, less the digital services. Let's say we also take care of in house installations for heating supply, let's say on the secondary side. So this is something we consider seriously how to enter this market and if.
If it's worth it for us with our structure, we a big company, big processes. So we are not good at handling small, tiny processes, let's say. So we're good in delivering a lot of heat and not.
Small portions. Thank you. Thank you for this statement. Milan. Are you afraid maybe that I would say Google takes, takes over this digitalization issue on a larger scale or Facebook?
Yeah, not really. Of course they are Working on a much more, much higher level, interconnecting different systems. But we don't see them going in with this kind of specific solutions for this infrastructure or this type of system.
But of course, if you have the connection to the customer, like you just mentioned, if you have a direct connection to the customer, if you have a display there displaying maybe the measure of heat, you could also show the TV program or the weather forecast or whatever.
So you can have this maybe shared services via one device. Sure, sure.
And for sure they are smart enough that they will be aware that they have very valuable data for certain systems, for cities, for utilities, and they will look into this, you know, so at this level I would say that I would see them more kind of as a data providers. But who knows? Who knows?
Okay, I have also one question regarding the temperature levels. At least during the research activities, we are talking about low temperature temperatures. We're trying, we're discussing also maybe return temperatures of 25 and maybe supply of 30, 35 to 40. In Hamburg you mentioned, Julia, that you have best return temperatures of 60 supply 90. We know that's of course the grid as it is. Do you have any strategies to transforming strategies to come down in temperature levels?
Yes, of course we do, because this would be the easiest way to serve carbon dioxide. So what we did is that we change the technical paper. Let's say the clients are kindly motivated not to bring home 60 degrees. The new contracts, they have to bring 50 degrees. So this is something you can easily do on the paper way, let's say. But on the other hand we also considered how to decrease the delivery temperature down from 90 or maybe even in winter times. And then we learned that we have more than 800 km grid in Hamburg and the diameter in the pipes we have installed since 100 years, you cannot just change them and have the same capacity, the same temperature. Of course, if you reduce temperature, so you have a huge increase in diameter for the pipes, if you just increase temperature. And as city of Hamburg is a huge city compared to others. In Hamburg, in Germany you have to do new insulations and this is something nobody would like to pay for. So the issue is how to decrease temperature in a running system which is installed within 100 years. It's not solved yet, but we are on it.
Okay, but one solution would be to reduce return temperatures first and then the supply temperature. Then it should have the same delta T and the same capacity at least. That's some strategies we are discussing in the annex.
So maybe Anna, we are offering some kind of Services to help Hamburg if there are some shortages or maybe some knowledge gaps in this transformation. Right?
Yes, you're welcome.
Yeah, of course we can offer a lot of services by using our district lab. They start at different supply strategies, as we already had discussed on bidirectional feed in lowering the temperature on return and supply. And also do measurement.
By building up a kind of digital twin and to test some solutions for your grid before to implement it in the practical world to ensure that these approaches are really, really working. And also regarding the pipes, there are some very, very, very great opportunities for testing.
Some applications.
How to increase or decrease.
Maybe a part of your pipe to make it more efficient with regard to the. How to say, to the capacity that needs to transform. And also for installation, maybe at the construction area.
New approaches for installation and also.
For feeding of. Of maybe solar thermal energy or for high fluctuating energy coming from industry as waste heat to make investigations between the pipes and the soil and all these things. So the range and the opportunities are more or less. How to say that.
There are a lot of possibilities.
I'm sure they are, as we are running out of coal within the next decade for sure. You can take this for granted. And we will build many, many different smaller.
Production units, let's say, or generating units. And of course we also are a company that needs to grow organically within our delivery area. And this is Hamburg. We cannot sell heat in Munich or in Tokyo.
It's always the local conditions that need to be taken into account when doing this.
Maybe to also add here just shortly from my side, I think it's worth to emphasize that any kind of investments into the district heating networks, basically into the primary side in terms of improving efficiency, lowering temperature, really needs to be also done in parallel with investment into the building stock. Because there is actually at the end of the day a sweet spot between these two investments.
To achieve the most kind of economically balanced result in terms of overall investment versus the savings or the potential.
Which we are achieving. So this really needs to be again looked really holistically from a complete level investment into the buildings and also investment into the network. And where is actually the sweet spot that allows us to achieve our target in the most economically acceptable way?
I can also just agree on this and emphasis this. You can just optimize the whole system from the combustion unit or the off gas heat unit down to end consumer. Because we are faced to reducing the temperatures in the grid. We have a lot of discussions with clients because they simply would have to install new radiators. And they don't like this amount of money they have to spend in new radiators. So they need our high temperature at the moment.
Have you considered some kind of booster units for difficult customers or customers with some technical problems.
That you lower the temperature on the general level for most of about all the customers and just the few who need. Where higher temperatures are needed. Get some booster units.
I don't get your question. So we have. Usually we have the new buildings which are fine with all the temperatures we would deliver, of course. And then we have.
The ones that are still there. They're sometimes 100 years old and they have their radiators and they need 90 degrees in winter or even more.
Okay, my question.
I think we hear in many discussions with utility companies, I could not change the temperature levels because I have old buildings in the grid and they need high temperatures. But I think we could also turn it around saying, okay, let's reduce network temperatures. And the few buildings who need higher temperatures get some kind of help via booster units to locally just boost the temperature for that building. That could also be. Could be a solution.
Again, the technology is there and the solutions like micro boosters or solutions with thermal storage on a building level and so on. So it can be done.
So we have a last question since our time is about over. Alfred, it's your turn. Hello. All together.
You talk about the boosters in buildings, but actually what we do at this time in Denmark is to boost network parts. Just a part of the network. And we do it centrally. So that's very efficient.
Okay.
Do you consider this in Germany?
Elsewhere.
I haven't heard about it. I don't know what's about Hamburg.
So I'm the saleswoman. So I sell the heat. I don't optimize the grid. Maybe my colleagues, they know more.
Okay, but maybe I can comment from our perspective as we are working with a lot of utilities. Yes. There are also utilities outside Denmark that are basically considering this. How to segment the networks. Basically to run different segments of the network on different temperature levels and optimize the network through this.
I agree with you as well.
In Hamburg for sure, to separate and segment the grid.
I know this approach is from a supplier that is located right in the middle of Germany. So they are thinking about the boostering just parts or just isolated grids, so to say, for having this approach realized also in Germany.
Okay, thank you. Then I would like to thank again our speakers. Thank you very much for coming and joining us. Now we have the chance for the next group picture.
From the second block. We already had a group picture from the first block. So please switch on your camera. And Raif Roman, you are the experienced.
Photo manager.
Thanks.
Just okay.
Yeah, I'm just waiting for.
Yeah.
Webcams are coming in perfect.
The quality a bit fuzzy but should be good.
Okay, that looks like there is no more cams added at the moment. So then I would like to make a photo. So please smile now.
And there was other people joining so I will redo make another.
Photograph now. So just a second. Here we are. So please smile now.
I don't like myself here but it doesn't matter. I will send you post pictures. Thanks a lot for turning on your cameras.
Yeah. So thank you for joining the second block of our webinar on the digitalization for integrated energy structures or energy infrastructures. We are going to start the third block on hybrid energy systems which is.
Chaired by Ralph Roman at half past three. So you have a little break and you could do some other things or if you want, you can also discuss with the other participants here.
We're looking forward to seeing you at the third block. Exactly.
Thanks a lot and see you in one and a half hours.
Thank you.
More from IEA
XIV-05: Flexibility and DH value chain (FlexVal) – advanced analysis & compatible pricing
XIV-04: RE-PEAK - How to cover peak loads in district heating networks with renewables.
Digitalisation of District Heating: Summary of findings from IEA DHC Annex TS4
25/01/2024: The crucial role of district heating pipe lifespan in achieving climate objectives
IEA DHC XIII-03 Generation of simulated faulty datasets to ease heating network fault detection
XIII-01: Leave 2nd generation behind: Cost-effective solutions for small to large scale DH networks
XIII-04: Cost Benefit study on the building secondary network for improving DH performance
XIII-05: OPTiTRANS - Optimized transition towards low-temperature and low-carbon DH systems