TS4: Testbeds for digitalization solutions in district heating
Industry experts discuss testbeds for digital solutions in district heating systems. Speakers from multiple organizations share projects and technologies aimed at modernizing heating networks through digitalization and innovation.
Chapters
So during our webinar we will have three blocks. The first one is regarding current development of testbeds and digitalization solutions in District Heating. In our second block we will talk about the newly developed digital energy test work from the art. And in the third block we will switch to Wandemi for a workshop and the knowledge exchange. And before we jump into the first block, maybe my colleague Ralf Roman Schmidt wants to say a few introductory words.
Yes, thanks Nico. I'm very excited to be here today for the webinar. As Nico said, quite amazed on the interest we have about 107 people registered at the moment. There's 41 people participating. So I guess some might either join later or they were just forgetting the documentation. And we will definitely send out the presentations. Still need to check a bit on how to put it, not how to, but if it's okay to put it on YouTube, the webinar, I guess it will be possible. If we will let you know. We sent the link to the presentation that Nico is currently recording. Yeah, my name is Nico said from AIT and I'm also active in the IA DHC Annex TS4 on digitalization webinar is kind of co organized by the by a national project we had at AIT on Digital Energy Testbed or Digitalization Testbeds for Digitalization Solutions. But it took the opportunity to join both movements and make a more general webinar on the topics.
I don't want to talk so much.
More, just going directly to the point.
I think Nico, you have the detailed agenda of the next block.
So our first block is about the current developments of testbeds and digitalization solutions. In this block we will have a short introduction to the Annex TS4 from Peter Schmidt from the Fraunhofer Institute that then we will hear about the ectocloud and Ectogrid developed by Ion by Daniel Sternberg. Then we will hear about the COSIS Lab from Daniel Zinsmeister of TU Munich. After that we will have an Intro to Utilith by Johan Kensby. And in the end we have a introduction to the District Lab by Anna Marie Tallard from the Fraunhofer Institute. And therefore I would like to leave the stage now to.
Schmidt from the Fraunhof Institute for a brief introduction about TS4.
Yeah, Niklas, thank you for the introduction. My name is Dietrich Mitt. I'm from the Fraunhofer Institute for Energy Economics and Energy System Technologies in Germany. We are a research organization and doing developments a little bit similar like ait. So thank you for inviting me and giving me the opportunity to present very briefly with. What is this so called Annex TS4 about? It's an international collaboration activity and we work on the topic of digitalization of district heating and cooling systems with a subtitle you see here. Optimized operation and maintenance of district heating and cooling systems via digital process management. And so what are we aiming at? So what we are doing? So I think firstly we all agree that our future energy system will be digital. So we will see much more digitalization in the energy systems during the next years. And I also checked briefly the other presentations. I think we have a lot of presentations here today which are touching this issue. And we are working in TS4 exactly also on this issue on behalf of the district heating branch. So what is the aim of our activity, of our joint activity? So it's one aim is to promote the opportunities for the integration of digital processes into district heating. So what can we do and what possibilities do we have here? Furthermore, we would like to collect implementation examples and show how it's. How it's implemented. And third we would like to take hand on new challenges like data security, data ownership and all these, I would say a little bit neighboring issues which somehow follow this idea of the digitalization issue on the broader scale. So the goals of our activity is one is create awareness about the possibilities and the advantages and what does it mean? Second to provide state of the art overview. So we are discussing in our working meeting a lot about latest developments, what's going on and so on. We would like to provide this one all these information.
In the final publication but also in workshops like today or like we had before. In fact we do in future. And third we would like to evaluate non technical barriers and enablers. Like what I meant on one hand maybe data security issues, but on the other hand also this big issue about business model, legal aspects and so on.
We are mainly focusing on three, let's say three focus areas within the broader field of digitalization. One is of course the optimization and real time operation.
For the grids for the district heating systems. Secondly, we are touching on this issue about digitalized planning procedures for the assets and the grids. And third what I mentioned before, one big issue is.
What does it mean, what for we are doing all this digitalization efforts so where are the business models behind and what are the processes behind and how it's working together? And all these three issues are of course touching each other and working together. So we are working in so called five so called subtasks. One Working group or subtask is focusing on the digitalization of the end use. So mainly how is energy used and how this one is monitored in the building. Here we are also touching the issue of data collection and monitoring. Secondly we have the digitization of the infrastructure on the grid side. Here we are touching very much this issue about simulation and digital twins. In the search subtask or working group we are focusing on the digitalization from a system perspective for both end use production and the distribution. Here we have very much in focus the analytics and the optimization and our fourth subtask, it's about digitalization of business processes because we think this issue about business processes is quite central to roll out more digitalization efforts. And here we have also the the key topics of case collecting, case studies and legal aspects.
That was my brief introduction, so thank you here for inviting me. If you want to know more, I think the homepage of the annex you have already.
In the agenda and in the invitation. So.
Contact us and may you also come to Denmark if you could meet or there. We are going to have a special TS4 session there at the Smart Energy Systems conference. And we are also focusing on an industry workshop in the frame of this conference or otherwise. Just.
Contact me, Ralph Roman or the others and you will look at more information. So thank you.
Okay, thank you. Dietrich, Are there any burning questions for him or regarding the TS4?
Okay, I think not. If not you can always post it in the in the chat if something comes up then I would like to ask Daniel Steenberg from EON to give us an introduction to the ectogrid and the ectocloud.
Of course, Nicolas. Hello everyone. Let me just start sharing my screen here. Give me a second.
Okay, so I hope everyone can see my screen and can hear me well.
So first of all thank you very much for inviting me to this event. It's very exciting for us to share how we work with digitalizations for our energy systems. The topic I will be speaking about here is the role of cloud and IoT based control for decentralized energy systems with some special focus on what we're doing with our ectogrid solutions. So it's a fifth generation district heating and cooling system we are championing from eon. Maybe just some notes about myself. Yeah, Daniel Stemberg is my name. You can contact me my email up here with questions afterwards. I have an academic background in applied physics with specializing in automatic control theory from Lund University. My role is working as a digital product owner at our Swedish office in Malmo, working with the within the energy infrastructure solutions division of the company.
I have been working with.
This topic with digitalizing energy systems and assets for a number of years, coming from the software development side, but now going more into strategy and.
Let'S say, conceptualization. So I'm a strong believer in how digital technologies can be utilized to tackle the new requirements coming from the future energy system and see a lot of possibilities and how things have been evolving there over the last few years.
So to start off the presentation, we see in the energy world a number of trends that are affecting how energy is being used and transmitted today. We see more and more intermittent energy generation, we see new consumption patterns with things like EV charging and heat pumps in buildings and everything that maybe wasn't as dominant looking 10 years back. We see that our customers are also becoming prosumers to the grid and that in general there are a lot of small scale systems and assets that are feeding into the main energy grids we have. And our customers are asking more and more about.
Using sustainable and renewable energy and becoming more self sufficient on these energy sources.
So they are really asking for and driving us towards a sustainable energy transition and we try to meet them with our solutions of course. But this new landscape is introducing a number of new challenges.
Just thinking about how you control and operate these new systems, it's becoming more difficult to coordinate.
And control all these distributed systems as compared to before where more centralized solutions were.
The most common solution.
And also with this intermittency and distribution, the control requirements are changing and becoming more complex.
Which is moving us from on premise solutions like PLC and status. Often they are not suited to tackle these challenges and to really orchestrate when everything is becoming more and more decentralized.
What does fit very well into these new requirements and use cases is the deployment of digital platforms. We see that cloud and IoT solutions, they are becoming more readily available and mature. We're able to get more data out of our customer facilities and our own operated energy infrastructure, enabling us to create data driven services and solutions on these type of digital systems.
We can also see that within the industry there is.
More maturity coming in in respects to interoperability like standardized integration methods and data models for this.
So from my own perspective, working with this, with controls, digitalization and also physics background, this is like yeah, I have a really fun job to say the least.
Eons answer then to this. Providing a digital platform to handle decentralized energy systems is the ektucloud. It is a modular multi application software for decentralized energy systems where we Are building applications for different types of solutions ranging from our single site solutions such as single site heat pumps or chps or PVR storage.
Going up to city quarter solutions such as the Ectogrid or other Lowex low temperature grids that are being rolled out in Europe.
All up to city supply use cases of the traditional large scale heating and cooling grids.
So the types of applications that we currently support and continue to develop goes within a few categories. Here we have tools for designing and dimensioning new energy systems such as the Ectigrid so that they can be constructed and implemented in a good way. Really we have control tools for system optimization, demand side management and sector coupling.
Along with energy efficiency that we provide to build customers buildings.
And especially the demand side management we use across many solutions. So we are able to use the same tools we developed for the traditional grids for the on site management and district heating. We can also deploy and see use cases for in our city quarter solutions like EctoGrid.
So how does the infrastructure run a solution like this?
How is it built? I mean within egg to cloud. We are of course have our cloud system where we can store and utilize high big amounts of data that we collect from all of our assets, all of our substations and systems and by using unique computational tools like machine learning and mathematical optimization, we have a very good way of doing the holistic system level control and optimization.
But we are also developing edge gateways so that we can integrate with all our assets in field but also put certain control logic into the edge environment to increase the robustness and reliability of the control we develop. It's a very important topic when we design new applications. How you distribute the control in a way that.
We can make it as reliable as possible.
And still unlocking the value of having data collected from all the systems.
Then of course an important part is how this cloud system can be efficiently scaled and integrated with the traditional systems out in the buildings such as BMS systems and PLC systems so that the integration with these systems is done in a way that every layer of control, so to speak has a well defined job, but also that it is reproducible so that there are standard interfaces where all control and integrations connect and.
And transfer data efficiently.
So then going into more specific what we do for ectogrid.
I don't know if everyone has heard a bit about the EctoGrid, but it's the flagship solution for the fifth generation of digital heating and cooling developed by Eon. It consists of a number of technical components we have.
Heat pumps and chillers in all of the buildings and the substations, together with distributed circulation pumps. There is of course the Grid 2 pipe system for sharing and transmitting heating and cooling. We have a storage unit which can store both heating and cooling depending on the demand balance. So as the demand shifts, we store different proportions of heating and cooling from top to bottom. And since it's a low temperature grid, it's very efficient at integrating any type of waste heat or.
Low temperature heating or cooling, or a bit higher temperature cooling in that case.
Into the system, which is not possible in our district heating grids.
So a key feature of this is that true intelligent control, we can shift the temperatures on the grid to maximize which type of waste heat we want to or need to integrate. The fourth component then is Ekto Cloud, the digital platform that we use.
So there are many interesting features of this system. Like I was saying, we have the low temperature grid. It is highly decentralized, so most of the production is actually happening inside the buildings, not centrally.
The pumping is also decentralized. So whatever pressure capacity that is needed is joint contribution of all the buildings. Basically the flow in the grid is bi directional. We have an electrification aspect of running large amount of heat pumps and chillers on often a single electrical grid connection.
An interesting aspect is really also this system is built with standard components like heat pumps, chillers, pipes, circulation pumps. All of these components are readily available on the market. The uniqueness of this is how we put it all together.
As you can already see from this picture, there are many considerations and need for a lot of deep thinking on how you control it in the most optimal way.
The type of control that we do through ectocloud.
Is really optimizing the merit order of which type of waste heat or centralized balancing heating or cooling that we need to put into the system.
So that we use the most efficient energy sources at the right time and also able to use the accumulator to store in advance based on forecasted.
Consumption.
A very important aspect is also varying the grid temperature in a way that we get the highest possible efficiency in all of the substations.
And also so that we reduce the losses in transmission and also so that we are able to harvest these low temperature energy sources. So there are multiple aspects of how you ideally.
Change and vary the temperatures on the grid. And actually this aspect of a varying temperature on the grid is where ectogrid has derived its name from. Like from an ectothermal animal that shifts its body temperature based on its surroundings.
We also have the demand side management where we can inside the substation, control either the production units or the heating and cooling loads, depending on the situation, to do things like peak shaving or sector coupling capabilities.
And some of the value that we create is having a system that is functional within the technical envelope, so keeping a certain Delta T and things like that, so that the pressure can be kept on the system. And beyond this, optimizing for performance either energy performance or financial or emission performance.
Connected Cloud is also, as I was hinting to in the beginning, it's really an ecosystem that we use for a lot of our energy infrastructure. And it is built so that we can continuously provide our customers with new features and new digital services based on this infrastructure.
It is a flexible platform that applies open standards and integrates with different types of data models so that it makes it easy to collaborate with our customers, with our partners and of course, research groups and institutes that we engage with.
And speaking a bit about, we had some previous discussions with the AIT that systems like EctaGrid, developing energy systems where ideas and concepts are being innovated all the time, having the possibility to have physical and digital test beds to quickly evaluate ideas.
Also helps us to.
Make our product development much faster.
So that was everything from me. I will also say that we have our. We have our pilot for the Ectogrid in Lund. So it's the town next to Malmo. We have a showroom and we take visitors here visiting groups all the time. So if there is interest in coming here in a group, please reach out to me and you will have the full ectogrid Ecto Cloud experience on site. That's all for me. So thank you very much.
All right, thank you, Daniel. We have two questions in the chat, one from Johanna Dangerbauer from Forward Energy. Could you explain the difference between edge control and local control once more?
Yes, of course. I mean, they are both.
Physical hardware within, let's say a substation. They are both computer systems. But the difference I would say is that these OT systems like a plc, they have a different programming paradigm like coming from industrial automation.
It's different than from the edge controller, which is a more standard software development environment like a Linux PC or something. So it's more free to implement more like you can have a machine learning model running in the Linux environment, but the traditional system doesn't typically support that. Of course, I know in some modern PLCs it's possible to have both within the same hardware.
Okay. And from Christian Todch. Kal, I hope I pronounced it correctly. You mentioned to control the grid temperatures you have to have valves to load or unload the borehole storages to control the temperature.
Yeah. The way it's controlled is that every unit on the grid, be it a building or one of these energy sources that we can integrate, like waste heat, we regulate the flow.
That they are emitting back to the grid so that a certain temperature is achieved.
And that also goes for like a borehole. So you mix the temperature so you're getting the right desired temperature back on the grid. So.
That is how it's done. Often it's like a pump and a valve in series or something like that.
Okay, thank you. If you have more questions, just maybe contact Daniel directly. And I would now like to ask Daniel Zinsmeister from TMNCHEN to give us a brief introduction on the COSIS lab.
Yes, one second. I'm sharing my screen. I think you should be able to see the screen now, right? Yes, perfect. So, yeah. Thank you for the invitation to this meeting. As mentioned, my name is Daniel Sinsmeister. I'm a PhD student at the Technical University of Munich. And my research focus is on the introduction of integration of thermal prosumers into district heating and cooling networks. And I was invited here today to present the Laboratory for Combined Smart Energy Systems, or schrodcosis. So the basic idea of the COSIS laboratory is that it's a smart energy system with five buildings where we have three layers. The computation and communication layer, a thermal network or the thermal layer and the electric layer. And we have five buildings with real hardware and power hardware in the loop. And we can extend those buildings on the electrical or thermal side by virtual buildings. And the buildings can be interconnected with thermal and electric grid and are easy to reconfigure.
What sets COSIS apart from other laboratories is in our opinion that we emulate the behavior within the buildings both on electric and thermal side in great detail by using real hardware or the power hardware in the loop approach.
The buildings are also connected with an electrical and thermal grid. And so we can do research on the thermal and electric side, both either separated or in sector coupling, and also on individual buildings or the whole smart energy system.
So starting with the laboratory control structure, we have high end real time controller from national instruments. We have one for the heat and one for the electric side at each buildings and at the grid. And the control is implemented in national instruments, very standard environment which can be divided into one part running on the different real time controllers and another part running in a host PC and Our control models are already designed so that they can be used for all models without.
Having the requirement to adapt them. Because it's not so straightforward often to program the controllers on the host PC, we can integrate simulation models, because not all models are able to run on the real time environment of national instruments. So there we can for example, run simulation models from Modelica based programs and use them to create the set points for the power hardware in the loop.
We have. Or with the help of the very stand gateway, we are able to use an interface on the host PC where we can for example, create simple energy management systems. Or if we want to have more complex energy management systems, it's often simpler to use some external communication protocol. We did that, for example, in a project with OPC ua and we have other applications like data logging or also watchdog control or similar stuff. And.
Unfortunately, in our laboratory it's not possible to directly integrate controllers from other manufacturers, but it could be done, and we are planning to do that in a project by mimicking the sensor data, giving them to the controllers then and getting the set points from the controller into the real time environment. It's not directly possible, but we are working on a workaround to be able to integrate them.
Since, as I mentioned before, the aim of the lab is that we want to replicate the electric or the behavior within the buildings as close to reality as possible. All our buildings are equipped with real hardware. In the case of the electric system, we have for example, EV chargers. In front of the buildings we have electric outlets or ports where we can connect different equipment. We for example, use that to connect our power hardware, our power to heat modules. We have PV panels at the top and batteries that can be connected to the houses.
To emulate load like the consumption of a household, or also different generation patterns. We have the external load emulator, which is a bipolar inverter, which is connected to a feedback grid that can draw or push energy into the system without consuming it in reality. And all houses are then connected to experimental electrical grid that consists of in total 10 cables, real cables, which are wrapped around the laboratory and have a total length of 1.8 km. The cable are can be.
Connected differently to generate a different topology. And we can also connect the building at different buses. We are connected to the Munich grid with on low tap changing transformers. And yeah, more information about the lab in general and especially the electric side can be found in the source, which I will show later.
We have now a look on the thermal side. We have also five houses on the thermal side, where we have.
Yeah, where we work with a modular design so that we can, with moderate difficulties, exchange the equipment of each house according to whichever requirements are needed for experiments or projects. But in general, all houses consist of the same modules. We have a thermal load emulator that extracts heat for domestic hot water or heating from the system, for example. This can be done by power hardware in the loop simulations or also field test data. We have a real storage, we have various real heat generators like heat pumps, CHPs or solar thermal emulators. And what makes our lab special, apart from the detailed emulation of the houses, is on the thermal side, the bidirectional thermal grid. So we have a bi directional heat and cold transfer station that allows the houses to develop prosumer behavior on the thermal side, meaning that we can feed in or extract heat or cold from the lab. Further, we also have one booster heat pump transfer station to be able to do that on the fourth generation district heating and cooling or district heating system, or also on the lower level 5th generation district heating and cooling systems, the houses are connected by a thermal grid emulator. And we have in general, this is the current setup of the lab. So we have a ring structure with two heat levels. And in between three buildings we have included a third level that can be used then for heating and cooling or heating on two different levels. And since we don't have a real grid like the distance between the buildings in the lab is too low. We have also here an emulator that can mimic the dynamics within the grid. So even though the buildings are within 5 meters distance, we can emulate the dynamics and losses for a grid of up to whatever we want in distance. And on the right side you see the bi directional heat and cooling transfer station where we have to be able to change the flow direction on the house side. And of course, if we are in the feed in state on the grid side, we need to overcome the pressure difference in the grid and therefore need an extra pump in addition to the control valve. And so that you can have a better impression of how the lab looks, I brought a few pictures. So on the top we have our airsource heat pump with the H Vac system that.
Emulates or sets the inlet temperature of the heat pump and the humidity. As to the experiment settings, this picture was still taken in the construction phase. So by now we have here also a closed.
Case so that the air circulates and yeah, by that we can then define the temperature and humidity. This is a picture of our CHP, the biggest one, with up to 20 kilowatt electrical power. And this is our heat consumption station. So we have heat exchanger that withdraw heat from the heating system and solenoid valves that are used as the taps for the domestic hot water. On the bottom left you see as an example how we can rearrange the position of the buildings in the electric side. So we have quite big cables and plugs and can there rearrange our system? And here you see the four electrical vehicle chargers which are so far still free of charge. So if you ever are in gaching and want to have a free charge for your electric vehicle, that might be an option. But it's because of that mostly blocked. And yes. So our courses team so far consists of of 10 people where Madeline Perich is the head of the research group. And for now we're looking for a new PhD student in our research project on bi directional district heating and cooling networks. So yeah, if you know a master student or yeah. Who's interested in this area, please feel free to forward him my contacts. And yes, that's it from my side. If you have any questions we can discuss them right now or feel free to contact me. And the paper I mentioned before is.
Shown down here. So yeah, thank you for your attention and I don't know if there are any questions so far.
Thank you Daniel.
So are there any direct questions?
Otherwise you can contact Daniel with the email.
Okay. I think for now no, but so then I would like to give the stage to Johan Kensby who will give us introduction to the data driven energy company tear down systems boundaries and optimize the whole value chain.
Thank you.
Just to check can you hear me now and see my screen?
Yes, thank you.
Great.
Then let's get started.
So thanks a lot for inviting me. My name is Johan Kensby. I'm the CTO and co founder of Utilifeed. We are a startup from Ioteborg who works with digitalization in the energy industry. And I'm here today to talk about the data driven energy company and how we can tear down the system boundaries between different parts of the company but also between the energy system and the control systems in the building and optimize the whole energy system as a whole. Just a very short background first and I'm here because I just like you love district heating and it's because it's a very smart system that converts waste from other parts of society into value for both the environment and the economy.
And I like to draw a parallel here to what we are doing. So data is the untapped waste of the energy companies. And we help energy companies to create value from this data that today is mostly used for billing purposes, even though some companies have come further. And we do this by developing a platform full of solutions and tools for the future energy companies. And the goal with this whole solution is to make the energy systems more efficient, lower operational costs and optimize also the investments to improve both OPEX and capex of the company, also more efficient operations. There are lots of internal processes that are developed individually for every energy company when they can be standardized and optimized across the whole industry. And also to improve the customer relations cost.
Energy companies generally have access to lots of interesting data and analytics for all their customers buildings. Thanks to that they measure and deliver the energy to them. And this data and analysis is also interesting to share with a building owner to create some extra value.
We've been going for five years, we're a team of close to 30 people. But we so far we mostly been like a company doing development and pilots. It's just this winter that we or last year we launched commercially, but it's the last month really that we have built a sales organization and it's really scaling up the business and becoming much more visible and active.
So.
What can you do to become more data driven in the energy business? It all starts with having a uniform and efficient handling of data.
And energy companies both measure a lot of data in all the connected buildings and also in the grid production units, etc. There's also a lot of metadata connected to.
All these components in the energy system. This data needs to be combined with data from weather service, from energy markets and also building data like age of the building, how many square meters.
Lot of different information.
So what we have built is a data management system that collects this data from many, many different sources. And what we have done is that regardless for what energy company it comes from, what collection system, what service, it's standardized and put in a cloud layer and made accessible through an API. And this also means that it has the same units, the same naming conventions, the same formats, same everything. And the reason that we do this is to have a standardized format and interpretation of data that a number of different services can be efficiently developed against. When they are developed, they can be rolled out to a large number of energy companies very, very cost effectively without needing.
Individual adaptations for each company and integrations.
And here are some areas that we work with where you can become more data driven. First is team working with measurements, validation and correction of faulty metering data. It's a huge task for many energy companies.
And that means that you often only do it to ensure that like the sum of the energy meter is correct at the break of the month, because that is what you need for billing. But in order to really do good analytics and also to enable future business opportunities where you have, for example, more dynamic price models, you need the data to be correct down to every single measurement. So we have created tools that fully automize this process and do it very efficiently.
Other areas is the teams working with market and sales. There are very powerful tools where you can analyze different customer segments, you can design price models, create budgets you can have. You can automate the process of how you create your billing data, for example.
And if we go more to the more engineering or energy system side of the energy company, then for distribution, there are really large values to reap if you optimize how you design the system. Sizing and design of systems are usually done with very simple models like just using linear regression to calculate the design peak. But there are much better machine learning models and other tools that you can use to improve the performance and realize really large savings in this area and other parts. Where you can optimize a lot is to monitor all the connected buildings in a city. We do this by creating a machine learning model of every building in the whole city and constantly monitoring the performance of the building compared with the model. And if the behavior starts to deviate, we can flag it as an anomaly and you can send out the service technician before.
A major fault happens and you have a very unhappy customer or large customer.
The last part, which I'm going to dig a little bit deeper into, is if you look also to the production side of the district heating system and look at the opportunities to optimize how you run and operate the whole system. Here are also very large opportunities for becoming data driven. And I will skip a deeper dig there for now because we will dive into it soon. But I also just want to say that if you have data that are normally in silos in the energy company, all combined and accessible in one data layer and analyzed, you can make really neat dashboards and tailored reports for those who want a quick overview of the company is performing. And also you can automate a lot of the environmental and government reporting that many companies need to do.
And basically, when you work in this platform, there are three ways to use the results. First, the energy company can interact with it directly through a web interface, which we have done our very best to make intuitive and user friendly. It's more inspired by consumer applications than enterprise solutions. So it's intuitive how to get started, a lot of automated and good settings, but you can dig really deep down into the settings and wikis if you want to do something very advanced.
Also, all data can be white labeled and included in services that.
Energy companies provide to the building owners. And lastly, we know that we won't solve, we will solve many issues for energy companies, but we won't solve them all. And.
It'S a huge benefit to build an open system where everything is built as microservices, communicating via APIs and also communicating with third party solutions via APIs so that you can build things on top of this or use data from the solution into your other softwares.
And let's just dive into one use case where you can use this data driven approach to optimize the whole energy system with an extended system boundary.
And traditionally building owners try to minimize the boat energy without really taking into account when they buy energy or how the profile looks. They just try to minimize the total sum. And the consequence of this is it ends up with a demand profile. And then energy companies are tasked with providing this demand profile at the lowest possible cost and environmental impact. But the problem here is that all kilowatt hours are not created equally. It's a huge difference between electricity district, heat, district cooling, what the building uses, and also when the building uses energy.
You can also see that like the different entities have their own system boundaries and they can be really good at optimizing within their system boundary. But what you really want and what we are striving towards is that we optimize the energy system as a whole. We try to control buildings so that they cause minimal costs and environmental impacts in the energy system. And to do this, the systems need to talk to each other. And you also need business models that gives everybody an incentive to do what is optimal from a system perspective.
And this is something we're testing now in five cities. So basically what we have done is that we have built digital twins of all production units in the grids. Also the distribution grids, all connected buildings in the cities to the grids have ML models which can do forecasting for heat demand, volume, flow and return temperatures. And also we model how the whole system interacts with electricity grid.
And this is a huge mathematical problem that can be solved with the target function, that is to minimize the operational cost over like a whole seven day period as long as you do your forecast, for example. So we pack this problem, feed it to a solver and it returns basically a plan of how to operate the whole system. And this takes flexibility into account. We have built APIs to the control systems in the buildings. So before we do an optimization, we send a question to them. What is your available flexibility? Both using the thermal inertia, but also buildings that have both district heat and the heat pump. We can turn off the heat pump when the district heating is cheaper to produce and vice versa. Also support for presumers delivering heat to the grid.
And like trading with neighbor grid storage tanks and new technologies as well.
So this is now being tested live and we're also combining it with building the business and price models for the flexibility. So otherwise it purely becomes an engineering solution where you calculate how to run the system. But in order for everybody to have the right incentive to do so, you need a business model that shares the savings between basically the energy company and the building's owners that provide the flexibility.
So this was what I had to present today. I hope you learned something interesting and that you have some questions for me.
Thank you, Johan.
I hope there's some questions for you.
Seems not to be the case for now.
Maybe you can provide your email so people can get in touch with you.
Yes, of course.
And if this is something you want to test on a grid, for example, don't hesitate to reach out. I put my email in the chat.
All right then. Thank you very much, Johan. And then I would like to go on to our last presentation from Anna Maria Kalad from the Fraunhofer Institute, who will present us the District Lab Test center for innovative heating network Solutions.
Yes, thank you very much for this short introduction. I hope you can see my screen. Yes, just give me an. Yes, yes, thank you so. Yes, hello, my name is Anna Kalet. I'm head of Department Thermal Energy System Technology at the Fraunhofer Institute for Energy Economics and Energy System Technology in Kassel. As part of my short presentation, I will introduce the District Lab, test center or test facility for innovative heating network solutions to you in the context of the new and tightened climate target. As you all know, District heating plays a key role in decarbonization of our energy systems and in fulfilling this role and to support it, the expansion and restructuring of the district heating supply is of great importance. I guess you know this all very well, but to cover these issues, the District Lab test facility to test new supply solutions, to test new control strategies for transformation and decarbonization of urban heat supply based on district heating is currently under development to be erected at the Fraunhofer Ie and the conception, the setup. The commissioning is currently being being carried out via the urban turn project that will be introduced very shortly at the end of my presentation. But let's come now to the district lab test facility. Here we have a main principle of the district lab. First we see the management system and the control concepts. The management system is used to control our facility and to test new operating and control strategies which are of intrinsic importance in the context of digitalization. A flexible heating grid on a lab scale is connected to this management system. This is a folded thermal network buried in the ground. And the network is used to carry out tests for different temperature levels between 90 and 5 degrees. So we have displayed several.
Generations of the district heating. The pipe test bench for mechanical tests serves to carry out real tests of the technical service life of pipings, including batting and laying techniques. The management system and the control system that I just presented accommodates the hardware in the loop units that provide the necessary sources and things for the investigations. Furthermore, a measurement and control system is used as a hardware software interface which is applied to control the digital twin that is connected or that will be connected to our district lab. With the help of these facilities, the new operational management concepts are essentially tested.
The work on the flexible heating grid focuses on the analysis of different supply scenarios, maybe for bidirectional feeding of volatile energy sources, prosuming and so on. And the results of the analysis are used to identify critical.
Variables and to examine some supply scenarios with regard to their potentials and to their obstacles. The investigations on the test section includes the analysis of.
The interaction between pipeline and soil, as well as the investigation of bedding reaction conditions. And the knowledge derived from this serves to identify new requirements or criteria for bedding materials and installation techniques. And if you are interested, further information can be found under the given links.
To perhaps say a few words about the principle of the test facility to simulate heat sources and things. Now we can see the main concept or the main components of the district lab heating network management system and pipe test bench for the generation of heat sources and things. Heat pumps and boilers are installed on the producer side, so to say, which are supplemented by a storage tank, hot and cold, so that the heat arrives where.
We require it, where we need it. By taking into account the objective of the tests that need to be carried out to simulate different demand loads and feed in profiles. Imitating house transfer stations, substations as well as decentralized.
Stations to feed in heat exchanges are used. And depending on the test configuration, decentralized heat pumps could also be used here.
The configurations then allow so called hardware in the loop units to simulate for example, solar feed in waste heat utilization, but also different types of building utilization. In addition to carry out our tests, the district lab can also be used for measurement and testing such as heat pumps, valves, substations and so on. Let's now have a closer look to the plant software based investigation of the selected technologies at the district lab. As part of the first step, the development and validation of a central control system as an interface for operating the test facility is intended. In the course of the work, the components, hardware and of the test facility are connected to the decentralized hardware in the loop components. And these are then in turn connected to the automatization system which carries out the central management and the monitoring or through the control. The measurement data are then passed on to the main management system and controllers and the interface to a central computer then allows the experiments to be carried out. In addition to our control system, a digital twin of the flexible heating grid and the pipe test bench is created. These are used to carry out and to control the experiments. And as a. Yeah. As a first version of the digital twin of the flexible heating system is currently available. The basic scheme you can see on this picture here and the last step for the development of the software based investigations of selected technologies at the district lab is the preparation of a measuring point plan for the implementation of investigations of the of the district level. So next to the software based investigations here we have the experimental investigations taking place at the flexible heating grid that are focused on different supply scenarios to identify possible critical operating variables and also for the examination of different supply scenarios with regard to their potential, but also to their obstacles. Maybe if you think about.
Bidirectional feed in of volatile energy sources, there might be also some obstacles that need to be investigated. Next to the investigations at the flexible heating grids, the investigations at the pipe test bench are focused on the investigations of the interaction of pipeline and soil analysis of bedding reactions and also some.
Other conditions that are caused by fluctuating pressures and temperatures. And these investigations serve for the identification of new requirements or criteria for.
New. Yeah. New.
Installation techniques or bedding materials and so on. Yeah. As I said to the beginning, the conception, setup and commissioning is currently being carried out by the project Urban Turn. You can see on the bottom, you can see our partners. This project is about the transformation, decarbonization and digitalization of district heating, taking into account volatile pressures and temperature when feeding in renewable energies and waste heat sources. This project is about.
The Transformation, decarbonisation. As I said.
To. To realize, to derive the main key measures and to develop and verify new approaches by simulation and experimental investigations. Next to this, approaches for the amendment of regulations and guidelines will be examined. And as a summary to all of the work that are carried out during the four years of working, we create a catalogue of measures to bring out our findings to the practical world. So to say. Yeah, if you have some further questions, you can contact myself or also Mr. Losses. We can also provide some answers via email. Thank you very much for your attention.
Thank you very much for this interesting presentation.
If there are no direct questions for now, then I would like to lead over to our first break. After that we'll have the presentation about the digital energy test bed and we will meet again here in up to 10 minutes. So around 1450.
Yeah.
Then I will welcome you to the second block of our webinar which revolves around the AIT Digital Energy testbed. Before that, I just want to remind you once more, please mute your microphones and if you have a question, just raise your hand or I'll just post in the chat. We will answer it later, of course. Please state your name and your institution before you speak. And also please turn off your webcam as it is for the spoken contributions. And after that block we will make another group picture.
So in this block.
We have a short introduction by Ralph Roman Schmidt. We will see the digital engine test with hardware, where my colleague Thomas Natiestra is already in the laboratory. We will hear about the lab with middleware by Edmond Wiedel. And from Andreas Voh and Aurelien Bruin, we will hear about the layout and models of the digital energy testbeds. And after that Thomas Nathiesta will give a live demonstration of the testbeds. And concluding that is then Ralph Roman Schmidt with a future outlook and possible use cases. So then I would like to give the stage to my colleague. Ralf. Are you there?
Yes, I am. Are you recording the session again?
Okay, perfect.
So I'm going to share my screen. Which one?
Just.
Perfect.
So can you see the screen properly?
Yes, Wonderful.
Yeah.
Thanks again for being here at the webinar on the digital energy testbed or on the digitalization testbeds in general for digitalization solutions. So we heard now a bit about digitalization solutions and testbeds. And now obviously our AIT own solution actually give a good introduction. And as Nico already introduced, there's a couple of colleagues involved in the whole development of the testbed that are doing presentations today. And that are listed on that slide.
Yeah, starting a bit with the background. Why do we need digital energy testbeds? On one hand we see digitalization is coming a lot. We heard that in the morning. On the other hand we also have things like sector coupling. Those are recognized as key enablers for decarbonizing and integrating distributing systems. In order to overcome the complexity of the full integrated energy system, digitalization is helpful. And an increasing number of digital solutions are coming available. Especially in the recent years, a lot of development had happened. However, the development, deployment, adaptation, integration of these digital solutions is part of quite complex. We see that also in the very morning and in the afternoon first session is block one and that involves considerable time and cost expansions. Also the transferability and comparability of the results can be very limited if that is designed for a certain situation.
So that that is basically the motivation where we came from. Now we saw that there's two backgrounds or two test beds available or two type of test beds at MABEL at AIT that's real test beds, that's for special purpose applications. At AIT that this is for thermal application. That's test port for distributing substation. Then we have a test bed for heat pumps. There's also a test bed or a smart grid laboratory at AIT that can emulate low voltage networks, but also things for electric vehicles, batteries, PV systems and so on. There's a couple of real lab test beds. There are quite individual designed or designed and currently available. On the other hand, there's a couple of virtual testbeds available that is one hand on district heating network simulations and using Modelica Daimler. On the other hand there's also a couple of building system simulations, Transit Energy plus. But again also we are using Modelica Daimler for building simulations. The good thing is they are there's an FMI compliant ecosystem that enables the interfacing of that simulation tools that can be used in a later stage. Now, using these two virtual and real lab infrastructure, we had the idea of this AIT digital energy testbed that is an open test environment for the evaluation further development and integration of digitalization solutions for integrated distributing networks. And that is basically wrapped around the idea of a middleware. A lab middleware, the lab link, the IT lab link. We will come a bit later to these both the hardware, software and middleware. Just very briefly, an overview what's happening. So we are this lab link middleware is able to connect the hardware the real lab infrastructure, distributing smart grid laboratory heat pump test beds and so on. But also is Able to link software like the simulation setups, other digital solution digital twins and so on. And very interesting we are going to do that also should be it will be is able to do that outside AIT to connect to external sources like doing remote access and control but also connect to IoT platforms as we saw them in the very morning. Sorry, not morning, in the first block and other lab infrastructure as well.
First block.
Now the current implementation. So that the project, the digital energy testbed was a national funded project. And in this project we created a prototype. A proof of concept has been implemented around an existing substation test stand. The test stat is here in the very middle of the graph on the right side. And that is connected via communication layer with the leveling middleware to both the simulation model of a display strategic network and the simulation model of building. I don't gonna go very much into details, just this is just a high level overview gonna go in all these different components in the following presentations now. And yeah, that's already from my side. So just think we gonna go to the next presentation from now on. Oh no, we're gonna change to the lab.
Yes, we will go to Thomas. Thomas, are you ready? The lab?
Yeah, hello, I'm ready Ralph. Please unshare the screen. So I think now everyone can see me in quite a reasonable size.
On.
Your screen because you need it. As we will show now the lab.
So I switch the camera, the main camera for the cell phone. So now you see we are here in the lab specifically for the as the deathbed for the district heating substation. The back you see the equipment of the test bed itself. And then for the front you see the substation. It's an ordinary substation which you can have a look, a closer look. You have the control panel, you can see for example now we have a set point temperature for space heating of 63 degrees. This comes from a 0 to 10 volt signal transported via this cable.
And so this is transformed into the set point value for the supply temperature. And here you can see some of the components, not all the main component which is the heat exchanger is here behind the control panel. We cannot see it, but you can see for example the valve which is responsible to control the supply temperature which was shown as the set point. I just show. And so this valve controls step less. And here you can see it's like 3/4 open. It's in the primary side district heating supply in the return. And depending on how much flow we have and how high the set point temperature in the district in the. In the space heating system is that much the this when this valve has to open to to achieve the required temperatures. So here you have also the connection. So this is I already mentioned was the return. The supply from the primary side from the district heating network comes here behind there's the plate heat exchanger. And the other two.
Pipes are from the secondary side which is connected to the space heating system of the building.
And how is this.
Integrated into the test stand? You see the pipings, the connections to the test stand itself and follow the pipes.
In this wall we have all the connections and all major.
Big valves to close the connections to the test bed itself. And we have also some magnet wells. And here this continuously controlling well which provides the mass flow in the. In the space heating system. Maybe we have a short look inside the control.
System itself. Here you can see a lot of relays. And here on the bottom we see the intelligence of the system, which is a.
Industry computer. This is connected disconnects to all components of the test bed and is also connected to the Internet. So it can be addressed by lablink. And let's have a last look. Maybe here behind the scenes you can see a lot of other valves and flow meters, pumps and the important.
Last but not least to mention tanks here on the left hand side front, which is almost not visible because too big is this 500 liters storage tank or the.
With a cold temperature about 20 degrees Celsius. This is acting as the heat sink of the space heating system.
And in the back we have this from the same size, the hot storage tank is about the temperature of about 100 degrees Celsius. And from this the supply from the district heating system is feeding.
Yeah. So these are the most important components of our test bed. And later on we will connect this to laplink itself. And I hand over to Nico. Thank you very much.
Thank you, Thomas. Are there any hardware specific questions which Thomas can answer? We will hear another presentation about a more detailed presentation later. So if there are any detailed questions about the hardware, maybe you can let Thomas know.
I think for now no. So I will hand over to Edmund for a presentation about the LabLink middleware.
Hi, can you hear me?
Yes, perfect. I will share my screen.
I assume you see my presentation now.
Yes, we can.
So yes, now something a bit different or not directly related to the hardware in our lab down there. But about the before mentioned lab link middleware that we use to connect this with other parts. Probably also with other labs, but also with simulations and probably other devices.
Just before I go into that just, I mean we heard pretty much about these topics already in the previous block. I mean basically we heard some examples about that. So there is, they're currently popping up more and more automation solutions for integrated energy systems that also include the thermal domain. But. Well, it's probably my point of view only but I would say there as it is always with new technology it's still usually quite complex and you have to specifically configure those solutions for very often demo projects.
But.
And they also typically develop for specific requirements. So there's still a lot development to do. I think that's, I mean for the scientists among us that's, that's basically.
A good thing to do. So we are happy about it. But it also means that there's still a lot of development and testing to be done.
That's also something else that we had heard previous presentations about in the previous blog that especially hardware in the loop test environments can be very helpful there. I think I don't have to explain what it means. You put your critical components that you don't want to model in real hardware and the rest you try to emulate in some way or another using some real time simulation. And one of the drivers between the project Digital Energy Testbed was that we see that these traditional approaches for automated loop test environments that typically relatively expensive, they rely on a lot of proprietary hardware and software and we thought if, if it was possible to actually try to go into a new direction here. So we see also especially in the electrical domain with smart grids, there's a new lot of initiatives and developments to go there into a more open direction. There are a lot of trends to look at open standards and open source software and also to combine this with.
With simulation coupling. So there's been a lot of work going on in previous years and we tried to pull all of these things together and show how to put that into one kind of cost effective alternative also for hardware in the loop test beds for integrated energy systems. So basically what this project Digital Energy Testbed tries to.
Or tried to go for was basically not so much.
To come up with a demo facility or something but really to provide a proof of concept for a concept for such open test beds for hardware in the loop. And in this specific case we focus very much on smart application for district peaking networks. But the concept is more general. The general aim was to as I said, combine existing map infrastructure and available simulation models. So I think these really beautiful and great test facilities that we heard in the previous blog, they are great but probably not everybody and not every institution can afford them. But there is already a lot of lab infrastructure existing, like the test that you just saw that Thomas just presented.
And as I said before, our goal was to somehow come up with a concept to create affordable hard in the loop testbeds for integrated energy systems with these available assets and with this available infrastructure.
Okay. So of course there are some prerequisites and requirements for such open testbeds that relate to the hardware and the software that you want to use there. So definitely one thing that you have to do. So if you have existing, existing infrastructure, you definitely have to have a means to remotely access this. So in our case it's a OPC UA server that is directly connected. There are other ways. I mean there are a lot of modbus and other interfaces that are available and but of course the test and or whatever you want to connect, it has to have sufficient quality of control. What do I mean by that? I mean small spoiler alert. You will see our demo afterwards. As I said, as we already mentioned, it's just a prototype and this test is primarily intended for really static tests of district taking substations. And we realized that, well, you can use it for dynamic simulations, but you will see that for example some of the valves for mass flow, they don't respond as fast as we would like that. And that's kind of work for the future. But that's what I mean here. So if you have some infrastructure, of course basically the hardware.
Has to be in reasonable shape and you have to be able to access it and manipulate it in a meaningful way. Then of course also for your software, basically that's the same story. So those simulations, those simulators that you use, they have to have some data exchange interfaces. Luckily there has been a lot of development in recent years, like example with fmi, but there are also other approaches to couple simulations here. So as I mentioned before, there is a big trend in that direction going on. And last but not least, we also wanted to go for open access. So to make that something that's usable not only by us. So what we said is really necessary here, that everything that we do here should be really open source software as much as possible. Of course, if you have a proprietary system of your hardware that's obviously not included, but everything that connects here should be available to everybody. And of course this also includes or not of course, but for us this also includes the standards for interfacing these components, be it either hardware or software. Based on that.
We took one of our internal Developments that have been going on for some time. And that's the so called Lab Link, a laboratory middleware. And we took that and we decided to make that public. So I will come to that. But that was previously AI team development from our lab, where we tried to really have a middleware that was able to connect different parts of our lab, like amplifiers and batteries and network and so on. And we tried to now extend it in a way that, that we are able to really also include all the components that we see or that we perceive as necessary for integrated engine systems and of course.
Engine. So that includes of course, access to hardware. So the Lab Link is a very modular concept where you have basically clients that can connect to different pieces. And here basically what you can do is you can have connectors to the hardware interfaces, but you can also have connectors to, let's say, simulators and simulation tools. What we really aim for, as already mentioned before, is those open standards. So in what we'll be showing today for simulation interfacing, we use the FMI standard, the functional mockup interface. And for the hardware interface we chose the OPC OA standard. And as I also said, so this used to be internal development, but we went open source just a couple of months ago and it's publicly available. You have the links here.
I will also show them later on if you're interested. And what did we do with that as a prototype? So we chose to use our test then that you just saw. There will be more about it in the next presentation. But basically that the central piece is to have Opcion connect to this test stand. We can either use the test stand or we can use a virtual twin of it and then connect it on its primary side that's supposed to represent the district taking side. The idea is to connect it to.
A very detailed, or.
Basically very detailed simulation of district ticking networks. And on the other hand, on the secondary side, it represents the building demand. We also have several options. In this case we basically went for botanical, but since FMI is nowadays supported by many tools, we could also do it for example by NHP or others. So that's kind of the setup that we have. We use lablink. That's basically as the queue between all of those things and each.
Piece of equipment that you have for each piece of information structure is then connected to a client and they exchange data via this Latin middleware. And just as an example to understand how this can look, then in a real world setting you could have a use case like shown here with a district Heating plant that feeds heat to consumers, for example buildings or typically buildings. And that's the interface between the two are, is a heating substation, district heating substations. But now if you want to have more interesting system, you could think about having the district heating substation somehow remotely controlled from the district heating plant. For example, you could have a set point for the secondary supply temperature or something and, and so on. So that could be a typical test case for integrated energy system or local, local energy community or whatever you have. And with. Basically what you can do is you can break it down with Lab Link. You can take this whole system and, and break the parts apart into what you want. So you see here in the middle that could be not a real test. Then that gets its basically its input for the primary side from a simulation model from the district heating system. So the whole system. And on the other hand you could, could have the primary site simulated also again.
With a simulation model. And as I already mentioned, basically you connect all these things together with dedicated clients that can interface to this and labeling provides the means for those to communicate. And if you want to take a look at this specific example, so that's already available online. I mean of course with digital twins or you won't have access to our test and, but basically you can run the whole thing locally if you want you can, you can install it. It's available on GitHub so if you're interested.
You can find it. And it's really quite simple. It's only a few things to install and then basically it's a lot. You have to click, do it to double clicks if you do it on Windows and the whole thing will start up and you will really see those things working as and running in real time.
Yeah, that brings me to my conclusion at the moment before I hand over to my colleagues as I said. So one of the aims of Project Digital Energy Testbed is to combine existing lab infrastructure and simulation models. And the goal here is to do that and to create affordable testbeds for thermal integrated energy systems. And the key technology that we provide here is as a potential enabler here is this Lab Link middleware which is an open source middleware for lab experiments. And it's. So far it basically relies only on open source standards for interfacing things like automation systems and simulation tools. With that I think I'm already. It took a bit longer than I was expected.
I hope.
You'Re not mad at me.
Thank you very much. We're still good in time, so no worries. Edmund.
Are There any questions regarding the lab link?
You can always. You will have the chance again later in wonder me you can talk directly to Edmund for some further questions and see. See you later. And now I would like to ask Andreas and Orion to present layout models of the digital energy testbeds.
I think you're still muted.
Sorry, I just need to find the right display, the right monitor and then I will share it.
So.
There it is.
I hope you can see it. Yes, okay, great. So, yeah, thank you.
My colleague Aurelia Brez and I will present you something about the layout and the models of the energy testbed. The digital energy testbed. And we start with a short overview of something what you have heard today and something you have seen in real time today. So for example, we have here lablink, which has been presented by Edmund now in detail. And this is the basis of our whole project. And what we will present now is for example the building model which will be presented by Aurelie Brace after my presentation part. So this whole virtual in environment we have used within this project and we have tested will then be finished at this part. And I represent you now the real in environment, not in real time, but on a schematic way. So.
You can see all pipings, all actuators, all sensors and so on, which you've seen in real time before also. But maybe it's a bit easier to understand how this system then works. So we start with an overview of the test bench at all. So we have on the. On the left side, the primary side, which represents the district heating system. As mentioned before, we have here our district heating substation. And we have the secondary side which represents then the building model. I will describe them a bit more in detail in the the following slides. So, first of all the primary side for the district heating system. There we have a really reduced scheme of the pipings and of the valves and of the sensors and so on. Otherwise it wouldn't be too easy to understand what we can control, how we control it and so on. But here are the main components which are relevant for representing the district heating system. First of all, our heat storage tank with a capacity of 5,000 liters, as Thomas has mentioned before, with a maximum temperature from about 105 degrees Celsius. And it always depends how much energy we need. And then we could raise it a bit or just lower it a bit so that the losses are less than at 105 degrees. This water they're stored will then be mixed by the freeway valve and the return temperature from the district heating substation so that we reach a flow temperature at the inlet of the district heating substation. Therefore, we have this valve here and we have our sensor at the entry of the district heating substation.
And the other actuator we need is then a two way valve with which we can control the pressure difference between the inlet and the outlet of the district heating substation. And we have tested it within a range of one bar to six bars. And overall we can, we can set there a mass flow from 0.1 to 6.25 kilogram per second. It was depends on which, which pipes we connect, because we have ones with, with a, with a bigger area and, and ones with a lower one.
But it always depends on the tests we want to perform there.
So this was overall the primary side with the most important components. We have also a pump in there, but there we have a constant rotation speed. So we do not really control it at this stage. And also for the test we see our first. Afterwards we have a constant flow temperature set there and a constant pressure difference.
So this isn't controlled by our model, but our model controls and communicates. In the end with the secondary side, which represents the building in the end there we have another reduced scheme of it. We have much more possibilities to connect it with the substation. But these were the ones we have used within this project. So again we have here a storage. This time it's a cold storage tank with a capacity of 5,000 liters again and we can set the temperature to 10 degrees Celsius.
The water from this tank will then be again mixed with the free using the freeway valve to get a return temperature, a specific one. And we've tested it from 15 degrees Celsius to 60 degrees Celsius. So we can set with this, with this valve the return temperature which our building models has calculated as return temperature. In the end, another important.
Value is the mass flow. We can again control the mass flow with this valve here. And again the pump runs at constant speed.
Here we have a mass flow range tested between 0.1 kilogram per second and 0.5 kilogram per second. But we could also test it up to 6.25 kilogram per second again. So with these two actuators we can set the mass flow for the building model and we can set the return temperature of the building model. So the last value we want to set is.
The flow temperature. And this will be controlled then by the district heating substation. You can see it here again a really.
Reduced scheme of it. There are some More components, but they are not necessary yet for us. So we can see here for example, a heat exchanger with a design point.
With design thermal power of 42 kilowatts. And we got them at a temperature on primary side of an inlet temperature of 90 degrees and outlet temperature of 60 degrees. And on secondary side we get.
Oliver set temperatures of 55 degrees in the temperature and 75 degrees outlet temperature. The second component which is shown there is the a two way valve with which we can control, as mentioned before, the two way valve and we have tested it between 35 degrees Celsius and 80 degrees Celsius. So in the end we now have.
We are now able to control the whole test bench and the dispute heating substation to represent the.
The building model.
And now I have summary here for you where we can see which are now the necessary set points we want to set and which are the necessary measured values that the model needs. In the end, first of all, again on the virtual side, our building model and this is then connected via lab link and this B and R automation system.
On the one hand, with the real environment, the secondary side of our test bench and with the district heating substation. So the model gives us the set point of the flow temperature which is then the set point for our two evolve of the substation. It gives us the return temperature set point which is then the set point for our freeway valve. It gives us the mass flow which is controlled within the within the building model to reach the specific interim temperature. And this is the set point for our two evolve on the secondary side. And we get.
Back the actual flow temperature which is then the input for the building model. In the end.
So now we can control the whole system.
We have coupled the virtual building model with our real test bench using Neplink and what it looks like within this building model. My colleague Aurelia Perez will show you now. So hope you may understand a bit in a bit more detail how it's connected, how it works on this side and if there are any questions we can talk after my colleague has presented it.
So yes, thank you for your attention.
Yes, thank you very much, Andreas. So, talking about the building model.
Now is my chance to tell you a bit about it, starting with a few key facts. So we are imagining that we have a small multifamily house connected with our district heating substation with classical rather high temperature radiator heating and the interfaces which Andreas just described. And how do we model this with the Modelica language in the Dymola environment, which allows US to export the model as a functional mockup unit. And we are modeling this based on the Modelica Buildings library at this point. Many thanks to the guys at LBNL because it's very helpful. So specifying this a bit further.
In terms of the system boundaries, we have the building envelope and the heat distribution and delivery to the zones.
In terms of modeling approach, Modelica is equation based. So every physical phenomenon which we want to model is reduced into equations.
But these equations are also packed into components. So we can say it's also component based. We have various physical quantities, so not only thermal powers, but also mass flows, temperatures and pressures. And linked to the fact that we are using an equation based modeling approach. The connection logic is acousal, which means that the flow of information and the model flow of water also is not predefined, but it results from the equations being solved.
Modeling approach is white box. So physical based and most components are dynamic component models.
Now putting some images on this.
With a small cross sectional view. So the whole building model at its core has a hydraulic circuit and building demand. The building demand is basically based upon centered upon a set of here eight zones and the corresponding heat delivery components.
If we look at each zone in detail, it has.
Various parameters and.
Material layers and it is actually based on the.
On a zone model from the Modelica Buildings library. And now if we zoom on a small component inside of this component we have equations. Again, that was a very quick overview of the building model. So part of this virtual environment which is interacting with the real environment. Thank you for your attention and looking forward to speaking speaking with you later.
Thank you guys.
Any direct questions for them for now?
Okay, then maybe you can also get in touch with them later in the wandme. They will both are available for your questions. And I would now give it back again to Thomas Natiesta who should have reached the office right now to start the live demonstration.
Please.
Hello again, can you hear me?
Yes, thank you very much.
So I would like to share my screen.
So now you can see the control panel of the whole test bed. I can here switch between different views. And we prepared the test stand so that this starting values are in the correct position for decoupling with the building model.
So first of all I have to change the modus to the connection via OPC UI here, I have to switch it and here.
And so now it's prepared to start the lablink software package which is very easily to start as it's provided to me by my dear colleagues. So first of all I have to set some configurations, which is easily done by double clicking here. It's already finished, I think done. I can check if the configurations are set properly if I use my browser. It's already here, the.
Address. So here in this table we can choose which configuration we want to have a look at.
For example, here, the mesh flow configurations.
This opens another screen, but I can bring it here. Sorry. Here you already see it. Great.
Yeah.
So here you can see the configurations which have to be set in advance. And then this is good. So we can start with the actual labeling software package, which is the other file. Double click. And.
Now it's on the wrong screen. But should not be a problem.
So I will.
Move.
The windows.
Position.
On the left hand side. You don't see anything because it's not yet updated. This comes directly from the building simulation. Now the values are here, the first ones in the right hand side you can see the values from the test bed itself. So you can see the red line is the supply temperature which is provided by the.
Which is provided by 0 to 10 volt signal. And on the bottom you can see the return temperature.
Which is set also via the lab link as a wire. Yeah, and comes from the building model. So I will make it smaller so I can.
I can show everything of it. So there's a third window which is missing.
Here. Subplot window.
Yeah.
So you can see that the values are coming and a plot in real time.
Maybe to explain the values from the last window which opened. Here you have the mass flow. The red one is the set point, temperature set point from the mass flow which comes from the building model via the lapling. And the blue one.
Are the values from.
The measurement from the test bed. It doesn't match fully, but we have to still work on this in future.
And maybe I can show a bit that it's also possible to interact with labeling.
So I can.
For example.
Ask which commands are available to check.
You can see.
And if I would like to set, I could set the room temperature, for example from the building system from a building simulation.
Then I would.
Take the command SVD.
And I want.
T.
Zone.
Set and I set it to.
21.5 degrees. Previously it was still at 21 degrees Celsius. So if I press enter now it says success. So now the building simulation received the value, is receiving the value from labeling and we have to wait some seconds because.
It'S not updated.
Every second, it's updated every 30 seconds.
So yeah, we have to wait also as the test bed itself does not react so quickly it's a tremor system, so it.
Is reacting.
With a bit of a time delay.
And.
Now we have seen the action of the first action. So the set point value was recalculated from the building simulation as a DMS flow set point. Let's now.
Risen to 0.17 and you see that the control, the controller of the mass flow follows this up and.
It tries to reach the set point earlier.
Yeah, so this will follow up as long as we run the software package. And thank you a lot for your attention and I hand back to Nico.
Thank you Thomas for the presentation. You can see the results and some more demo cases we did later in wonder me now I'd like to ask Ralph to explain a bit what we are planning on doing in the future with the Digital Energy testbed.
Yeah, thanks Nico.
Sharing my screen again.
I hope you're able to see it.
Yeah, I think that we did quite a. As Edmund mentioned, that is basically what's happened is a proof of concept. So it was a rather small national project. So the prototype is available. It has been implemented around this existing strategic substation test stand. As we saw, there's still a bit of optimization potential, especially on the substation test and responsiveness dynamic operation that we cannot very well follow the set points yet. But there is some improvement options or improvement potentials. However static. The testnet actually is built for static testing. So setting up a certain stable test situation.
That is possible already. So if you want to check, for example if you have different substations, either check the performance of the substation or you can also put in a fault. Many substations are faulty. So if you put in a fault like a warm heat exchange or make a warm connections or whatever, put in the four dots in the substation, we can test the substation then do different test runs with this integrated setup. On the other hand, as Edmund already pointed out, the software functionalities are well developed. So the simulations but also the specialty connection and communication via lab link has been successfully tested and that is our key enabling technology.
The outlook now is that as I said, the testbed is available for test static testing procedures in principle, however, the optimization towards dynamic optimization is a future activity. But very, very interesting also is the implementation of other AIT test beds like as I said, smart grid heat pump test facilities and so on. And most exciting thing is going to be opening the whole thing that's at the moment all in AIT internal settings. But we want to extend, or we're planning to extend the Digital Energy testbed. To partners outside AIT and make the digital energy testbed available for research projects.
So that yeah, the labnic flexibility offers a wide range of possibilities to various testbed setups.
Including the integration of various digitalization solutions and test stands. So here on the right side, maybe your logo going to be in the front future if you want either have a IoT platform or some test facilities for heat pumps, district heating labs.
The ones for example we see in the first block. In principle I see two different use cases. The first one is the design and supporting the design and operation or even optimization of innovative systems combining different hardware components or even single hardware components as we saw substation heat pumps. But the lab link could be suitable for many other hardware equipment as well. Batteries, electric boilers, storages.
A pv, PV plant, a wind energy plant. A lot of different options are possible with the Lab facilities and ZLab link. That's the one looking at the individual component or system of component levels. And the second one is more it's a high level system, software control and the loop setups. So having for example IoT platforms as we've seen in the first block. And then we can use that lamp link infrastructure to test and validate the.
Digital.
Controllers via digital twins based on analytical or data driven models between predictive simulations, controls and integrated systems. So that's the two possible use cases I see mostly and I'm very looking forward for discussing them in the next final block of today's webinar.
So that's already from my side back to Nico.
More from IEA
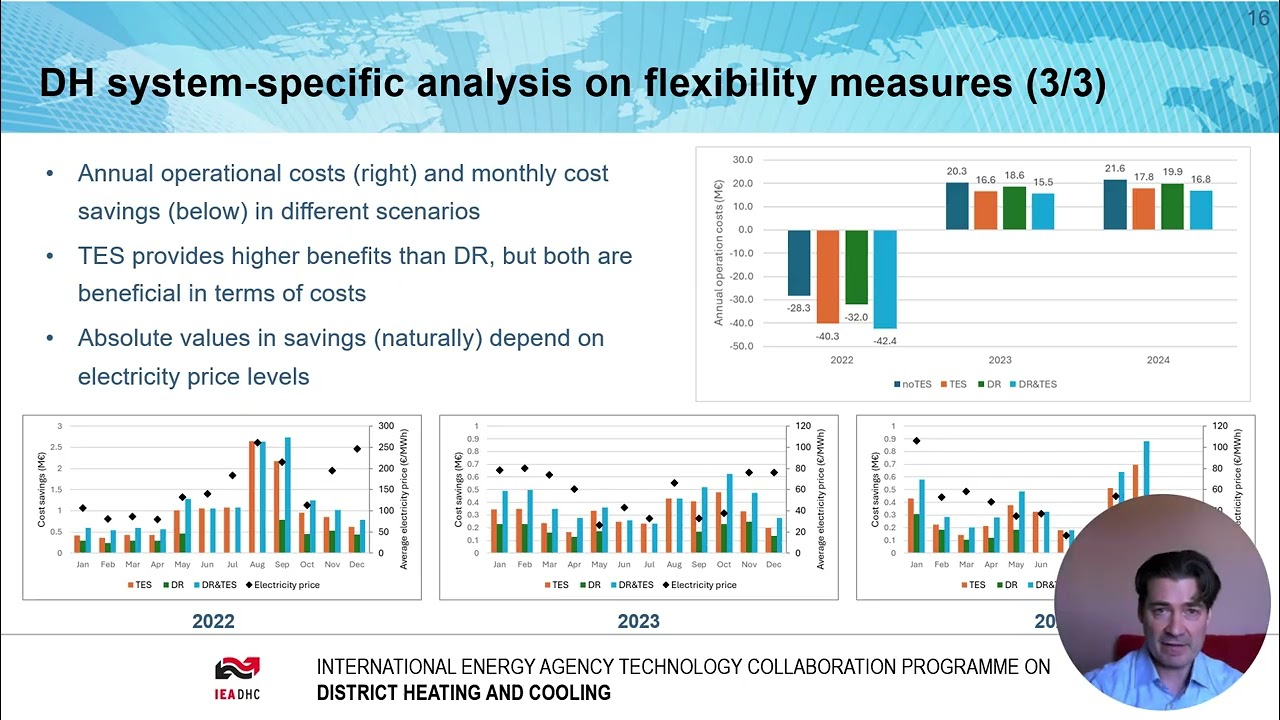
XIV-05: Flexibility and DH value chain (FlexVal) – advanced analysis & compatible pricing
XIV-04: RE-PEAK - How to cover peak loads in district heating networks with renewables.
Digitalisation of District Heating: Summary of findings from IEA DHC Annex TS4
25/01/2024: The crucial role of district heating pipe lifespan in achieving climate objectives
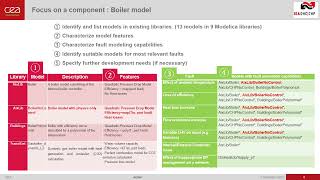
IEA DHC XIII-03 Generation of simulated faulty datasets to ease heating network fault detection
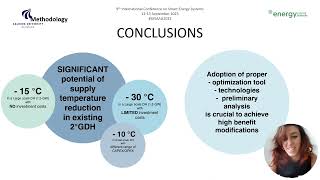
XIII-01: Leave 2nd generation behind: Cost-effective solutions for small to large scale DH networks
XIII-04: Cost Benefit study on the building secondary network for improving DH performance
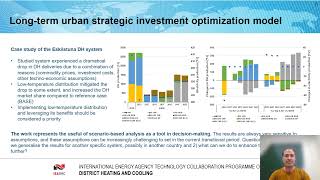
XIII-05: OPTiTRANS - Optimized transition towards low-temperature and low-carbon DH systems