IEA experts and vendors discuss digitalization in district heating and cooling. Topics include heat-cost allocators, lowering supply temperatures, digital twins, and cloud monitoring. Key barriers: data standards, ownership, and skills gaps.
Chapters
This conference will now be recorded.
So welcome everybody to the webinar District Heating and District Heating Digitally.
Sorry.
Welcome to the webinar on digitalization of district heating that is separated in two blocks. This is the first block from 10 to 11:30. This webinar is held in the framework of the idea.
The District Heating and Cooling Annex TS4 Digitalization of District Heating and Cooling. My name is Ralph Roman Schmidt. I am working at AIT Austria. This is one of the largest non university research organization in Austria. I work a lot on district heating and integrated energy systems. Operating agent of the IADHC Annex TS4 is Dietrich Schmidt from Fraunhofer IEEE from Germany. So we are together organizing this webinar.
We will have a lot of information on what is an IEA, what is the DHC Annex TS4. A bit later.
Just want to at the beginning let you know that this webinar is wofsa.
This webinar is recorded. I don't know. You might have heard the voice. The video file will be available after the webinar together with the presentations. If this is not good for someone.
Please let me know. We will cut out whatever is not intended. If you think this should not be shown.
There is some other etiquette for the webinar. We will mute everybody by default, just as I said, just to avoid noises in the background. I guess a lot of you now have experience with webinars and telcos, so it's always good to be muted.
You are able to switch on yourself. So this is called soft muting. So if you want to talk, it's possible to do so. Sorry.
It'S possible to do so, but please, only if we are. If there's some important points and afterwards, please unmute yourself.
We also try to avoid too much. Too many people talk at the same time. So if you have a request to speak, you can go to the chat window and type in rts. You can obviously also type in your question. Already we will have a couple of moderators. That's me, that's Dietrich, obviously. And my colleague Benedik Leitner is also supporting me with organization. So he will monitor the chat room and see if there's any questions or if any request to speak. He will take care on that and make me aware since I am very much concentrating on the presentation. Unfortunately I have only one monitor, so I do not see too many things at the same time.
But we will manage to do so. If you speak also, please state your name and institution before you speak to make everybody aware what is.
Where are you from and what's your background?
We will also turn off webcams automatically. That should be done as well from my colleagues, that everybody turns off webcams in order to reduce the bandwidth, to make the things again smoother. For those who are speaking, we can turn on the webcam, if you would like to do so.
But just as Michael asked me in the early stage, just for those who are interested, we can ask them to turn on the webcam. Then we can. That's a bit nicer. If you see those who are speaking.
We will make a group photo at the end of each block. So that is a group photo. That means when we finish with everything, everybody should turn on his webcam. If you don't want, obviously you should not. Or you can maybe just look at the background, if anything is okay in your background.
And then we can turn on the webcam, but very briefly, just see if we get 100 pictures on one screen. I don't know, I've never done so. We did that the day before yesterday with another webinar that was about 30 participants. That worked well. But let's see if we can do that for 400. What we have as well.
And yes, obviously if you speak, if you talk, be cautioned with humor and sarcasm, since that is maybe not understood by everybody.
Second, what's happening here?
Got some. Yeah.
Yeah.
Going to the webinar. As such.
There is no strict timing. We have some buffer at the end. We have four presentations in the first block, starting with an introduction of a funding instrument, the eranet call on digitalization. Michael Huepner from the Austrian Ministry of Climate Protection is doing that presentation. Then we're going to have an introduction into the Annex TS4 about the optimized management and maintenance of district heating systems. District heating and cooling systems via digital process management.
Then we have some spotlights from the annex. The first one is looking at the use of heat cost allocator meters to improve operation of heating systems and buildings. That is done by Sven Svensson from Technical University of Denmark. The second, the last presentation of the first block is then done by my colleague Benedikt, who is working on the. Who will present on the optimization of district heating networks with digital methods and trends. The question and answers. We will have a possibility after each presentation to have some questions. As I said, please put them either as requests to speak if you would like to formulate your question directly in person, or you can type in your question directly in the chat and we will read it out for you. And if there's some clarification obviously we can talk about that and at the very end let's see how much time we have. We will have another more time to do question and answers to our presenters depending a bit how much time we have. But this is a bit of buffer but we will end at 11:30 the first block. Then just give an outlook already in the second part. Most of you will participate in the second part as well at least have registered for the second part. We will have again after 12:30 possibly to dial in for those who are new.
At one. We start then with one Central European time. We will start with the webinar and we have three more commercial presentations. The first one from Samsung on some district energy the energy savings Energy savings enabled with digital solution. Martin Brisso will present this one. Second one is Danfoss Digitalization in future energy systems. Future District Energy Systems from Helmut Kahner from the Austrian Danforth branch. The last one is on digitalization use cases and implementation barriers from Gunther Back and partner that is working actually together with Schneid and Noda. So that is a presentation from that point of view. We again have some question answers to these presenters but a bit shorter since I put in another section here that will be a more interactive section than at the very end of the second block on opportunities and challenges for digitalization and district heating and cooling. And there will be some slido that is an interactive webinar format where we are able to give some.
Interactive possibility to ask questions or to not sorry, not to ask questions but to state your research the challenges you see and we will then put them all together in a nice way. You will see that surprise how that's going to work.
Yes, that is basically this one. I just think if I have something forgotten to mention I would like to say this is a premiere for me as well. I mean that's the first webinar I do myself especially such in such a big group. I am quite confident with workshop organizations. I have my own district heating conference so I'm quite confident on this side. But with a webinar all these technical difficulties with people are in each and every room with.
Only the small screen with my son that just wanted to sit beside me and you might hear if he's a bit noisy in the meantime I would try to tell him not to be but he's not in the age to fully understand that one that it's important to be silent.
But we will manage. I guess a lot of us have similar issues with home office and Kids and these things. So that's an experiment for me. I hope it's a pleasant experiment.
I'm quite curious. I think it's very good presentations and a lot of participants. That was really surprising for me since the invitation has been sent out very recently to have so many people attending in the webinar. So long talk. Don't want to go too many, too much into details of this one. And I guess you're all eager to get on the presentations. So then let's start with the first one. Michael Huepner from the Austrian Ministry.
That is eager to tell you about the new eranet call on digitalization. Michael, are you already. Are you already there?
Hello.
I'm clear to start.
Perfect. Should we give you the webcam?
Yes, if you want. It's nice that those days, and you mentioned it already, we are learning a little bit about people's homes and their children.
My son is already 16, so he will not come and try to sit by my side. It's more that he's somewhere lost in the. In the Internet space and in his room for the whole day. And if you leave him also for the whole night.
Thank you very much for inviting me to this webinar.
The reason or how we are related to is that our initiative, the joint programming platform Smart Energy Systems and the IEA TCP on District Heating and Cooling.
Have partnered up. So you, as District Heating and cooling initiative are an associated partner to our initiative, which I appreciate very much. And I'm going to present very briefly a little bit. What is this animal that I'm talking about this, this joint programming platform Smart Energy Systems and what are we doing and focusing in at the moment? And then I will come to the point where you as a community come in.
By the way, the camera is not open yet, so. But if you want, you can.
Maybe because I have the presentation modus and if I switch between presenter modus and the. Then everything goes strange.
Maybe.
Ben, let's stick to the slides. Yes.
Okay. Ralph Common, if you could switch the slides for me. So this is what we are. We call that a joint programming platform on smart energy systems. That means we have gathered meanwhile more than 30 funding partners. That means national funding agencies, ministries, organizations that provide public funding to research and innovation activities in the field of smart energy systems to a joint programming initiative. More than 23 European countries and meanwhile also beyond.
Europe are participating in this platform. We are trying to initiate and fund.
R and D and innovation projects in the field of smart energy systems going from lower TRL levels Where it's more really research focused, really also into the more already application of innovation. So TRL 7 we are trying now TRL 8 projects. So it's a lot also about trying to demonstrate the outcomes of the research that we are funding.
Next slide, please.
So we started.
In 2015 with what we call a focus initiative on smart grids in the electricity networks and now moved on to other focus initiatives that we have started. You can see here we One focus initiative is dealing with what we call integrated regional energy systems that has started in 2018.
Late last year we started an initiative on energy storage solutions. And this year we are starting an initiative on digital transformation of the energy system. So the main question in focus here is how can we leverage on the power of digital transformation in order to help and support the energy transition.
You see that already a number of joint calls for proposals has come out. Mainly every year since 2015, more than 100 million euros have been invested from these public funders into projects. Beyond financing those projects, we are working together with the funded projects in what we call a knowledge community because we. We don't only want to stimulate and fund such projects, but also work with them to understand where we are in the development of different technologies and technology areas and solutions and what we can do in the next step. In order to get a better knowledge about what is ahead of us and to be prepared what could be the next interesting topics, we started to form this associated partner network and IADCP DHC is definitely a partner here and therefore I'm very happy that I can be with you today. Next slide, please. What we try to learn from our associated partners, of course is about different specific technology fields. So.
You have a number of goals and objectives that we are following here on this slide. The main thing I think is really that we want to.
Take up new topics form new initiatives. This autumn we also are starting to talk about couldn't we do a focus initiative on heating and cooling? Maybe this will then start next year. Let's see. But the important thing is I want really to motivate you to become a family member in this club. There are two options to do this. One is you hand in an RD project and you get funded. The other ways you can always become a member of the knowledge community as an expert. So check out our website and you will find your way to the knowledge community and you would be able to register and participate in the working group meetings and in the workshops and initiatives of the knowledge community if you register as an expert there. Next slide, please.
You see here the timeline for this new initiative on digital transformation in the energy system. We are now in the area February, May where we are starting to discuss with our funding partners how a joint call that we want to launch in September could look like. You also see this Mission Innovation Call 20 logo here because this is going to be our second joint call that we do together with Mission Innovation. So also Mission Innovation countries from outside Europe are invited to participate as funding partners in this call. We have already India and Morocco on board. Others have shown their interest and we will see until summer who will join this initiative.
In September when the call has opened, or from September to December. There will also be a number of matchmaking and proposal development events where we try to help project partners to find each other. As such a global initiative, it's for. Sometimes it's not easy to form project consortia and we want to support that. Next slide, please.
Here you see and here I'm coming to the point where you come in with your workshop today. We have to structure a little bit the area. The field of digitalization is very broad. We have identified four domains or four areas in which we could imagine to support projects. One is the technical operation of energy systems. The other is the market operation. But then there's also the broad and basic topic of communication and the topic of business operation. What we are interested in is to identify key challenges in each of those four energy digit domains and key opportunities so that we understand what.
Upcoming R and D initiatives should work on. And this is where you can come in with your workshop today and your webinar. We want to learn from you about these key challenges and key opportunities. Please, of course don't expect that what you propose or what you develop or discuss here will show up in a. In a call text 1 to 1. But of course we will digest and try to understand what you are developing here and try to respect that in the outline of our joint call, which is also on the other side of course very much defined by the scope that the national programs have that participate in this call. So we are not free to do everything. Unfortunately, we have always the boundaries that our partners have in their national programs. I think we are nearly at the end. Next slide, please. Yeah. Here you see the funding partners. If you discover that there is no funding partner from your entire country and you want to participate in this joint call in autumn 2020, you could always try to link your national funding agency or funding responsible ministry to. To this initiative. Just make them aware that it exists and try to link them to us. You find everything on our website, www.aeronet smartenergystems EU in the Internet. If you Google it, you will find it. Thank you very much for the opportunity to present this initiative to you and we would be very interested to learn during these discussions today and presentations today. But also if you have any summaries that you want to send us, summary conclusions, we would be happy to receive that and to share that in our community. Thank you very much.
Yes, thank you, Michael. The virtual applause is difficult that we see. But anyways, thanks again for the presentation. One thing I would like to highlight what I forgot to explain a bit, the framework. When we first thought about the Annex workshop on digitalization or in District Heating, I was talking to Michael, if that is possible to make it at the Ministry. And he was quite excited to do so because there is, as he presented us this initiative on funding calls for digital transformation in the energy system. So there was a very, very good match between these both ideas. One, the Annex experts and industry people talking about digitalization. On the other hand, the funding partners who are looking for input, what are the real needs in the market? What is the real requirements for going a step further for implementing innovations with digitalization in the energy system? And obviously today specifically in District Heating, I think especially since the street heating is a bit of a black hole for many people as such, and especially for many people for the digitalization, there is a lot of talks when it comes to electricity network and electricity systems on digitalization. District Heating is catching up and actually there is also funding partners in the call as what I saw from UK people from Bias, the Ministry who's responsible for supporting the street heating.
So maybe that's an opportunity to get even on that level people aware what is happening and get them together. So I might add, since I don't see that now very well. Is someone already. Is there any questions already?
I don't see anything in the chat window.
Is there anyone who would like to ask, is there any requests to speak from your side?
I don't see anything.
No, there's no question. So everything seems to be clear what.
What.
Michel said.
In the meantime we have 115.
Presenters, participants. That's very good.
And yeah, I'm looking forward for that, for the going further into the digitalization details now. And as a reminder, at the end of the second block, we go especially exactly to these questions that Michael just had. What are the. What are the challenges in digitalization specifically for District Heating? So based on all the presentation we have now, you can Give yourself insight, you can think about your own challenges, what you have when you go for digital solutions in district energy.
And we can collect them at the very end you have still time to research them, maybe formulate them. Well get inspired by the presentations and put all these questions together that we can at the very end put them, have them in the chat and on this interactive format. Obviously you can also email them to either me or to Michael.
And then they for sure will look at them.
So now I got, now I have a question. In the chat there's a question for Michael. Can you explicitly repeat what where we can propose a presentation of a national set of projects on smart energy systems with reference to districts and district heating and cooling? Michael, can you maybe say something to that question?
Yes.
I'm not sure if I understand correctly, but if you.
Intend to bring the outcomes that you already have from national set of projects, this I think would be very interesting for what we call the knowledge community where our funded projects but also many national and European projects come together and exchange their state of knowledge and try to work on cross cutting topics together.
So this is called the ERANET Smart Energy Systems knowledge community. And you find it, you find on our website a link where you can register to this knowledge community and I think the working groups will be more than happy to receive and to exchange knowledge with you and receive the outcomes of your projects.
And what I wanted to highlight this is for the Internet policy for funding new projects. So that is maybe, I don't know if that is completely clear but this is really fresh money from your national funding agency. If your national funding agency is participating. If you see a familiar logo here on the screen, you're happy that you most likely will able to participate via that national funding agency. If it's not on your screen, as Michael said, make them aware of the initiative. Everybody even it's not a European initiative, as Michael said, it's. It's an international initiative. So even Korea, us, China, that everybody who is interested in mission innovation, I think it's very eager also to might be very interested in going to this funding program. So if you would like to get fresh money from your funding agency, just contact them and see what the next call that's coming out.
Exactly. So in September there will open a new call. So we will fund new projects and the knowledge community that I described before is ready to receive your projects and outcomes that you already have. Thank you very much.
Let's go to the next presentation.
That is then the background why we're doing that webinar first was the overall background. What is the. What is you're getting your motivation or getting Think about what is your challenges. Get money. Maybe at the end get research money. Not only research, but really implementation money. Even that depending on your national funding systems you can get real implementation money. But now we go to the next thing, the knowledge community, let's say from another point of view from the International Energy agency, the Annex TS4 from the district Heating and Cooling Technology Cooperation Program. Dietrich, are you with us?
Yes. Thank you very much, Ralph Roman for this nice introduction. My name is Dietrich mit. I hope you are hearing me. It looks like that everything works fine. So I'm the so called operating agency coordinator of this upcoming IA initiative on digitalization of District Heating and Cooling with a subtitle Optimized operation and maintenance of DHC Systems via Digital Process Management. I'm quite happy to give you a short introduction what we are doing, what we are planning next.
Alf Ruman.
Please give us the next slide.
Yeah, I did we see it already. Sometimes it takes some time till the slides change on your screen.
Okay, thank you. But I'm still see the old one.
Damn it.
So.
I hope our future energy system will be digital. That's the one I have online.
Yes, that's fine. Perfect. Yes, I got also this digital lady. Thank you. So I think we all agree that we are going into a more digital future in terms of our energy system. And I think one step here is not only to follow the line of electricity people of the electricity grids, I think especially the district heating industry has something to do with more digital energy future here. And maybe I would like to spend some words. What is this initiative about? So this so called Initiative TS4, which is the name or the short name is a platform. So it's not a project where you can look for funding and get your things funded. It's a platform which is hosted from iadhc. From this platform to exchange knowledge and to combine different projects and to come to a closer international collaboration. And it's still open. So we are still in the so called preparation phase. So we are just finding ourselves and setting up a work plan what we want to do and what we are going to do within the next three years here. And what I'm going to present is our idea, what we are going to do and what the group has decided until now where we are heading and what we are doing. Thank you. Next.
So in terms of background for the digitalization especially District heating and code cooling networks are traditionally operated with quite limited Number of controls I know and we all know that it depends a little bit on the grids and on the operators. But in terms of what is commonly done in the industry.
This issue about digitalization is not really coming from the district heating and cooling. But I think district heating and cooling has a lot of opportunities especially in this field of a more digital future. So why the implementation of information and communication technologies as in other industry will open up or opens up for better network management based on real time measurement data and not only the management. Next.
Takes some time and of course we see we have some opportunity so we can offer flexibility by integrating digital processes to match better with the demand side and with the production side. We will see some peak shavings. Already realized projects show quite good opportunities for that. We see that we can enable higher integration of fluctuating or renewable energy sources when we control, when we have better control upon our grids and especially also better communication to our users. And third, I think we all see that not only on the technical side, we have strong challenges and strong opportunities for the digitalization, especially when it comes to market potentials and business opportunities. We would see new business models and opportunities for district heating providers or related industries in this field. Next.
So the key aim here in the proposed or in the starting DHC annex is we want to promote the opportunities for higher integration of digital processes into district heating. And of course by doing it, we want to clarify the role. So what is the role for digitalization different parts within the operation of a district heating system. Next. So it's not only this provenance opportunities also showing what is going to do and we want to demonstrate this technology in real life and to look for cases where it's been done and also share our experiences here. Next.
And on the other hand also the new challenges which need to be tackled within this digitalization as data security, privacy and of course about data ownership need to be handled in relation also to legal requirements from the different countries. And we want to take care of this as well. Next.
So the principle it takes some time. The principal goals of our annex is we want to create more awareness about the advantages for implementation of digital processes between different stakeholders. End users in the different industries could be the utility companies, the district heating providers, but also the system provider or the communication industries. So on various sides and of course also on the side of the housing company, we would like to provide state of the art overview over the digitalization of district heating schemes from R and D projects, from demonstrators and from case studies. And he would like to Evaluate the non technical barriers and enable us for the digitalization processes, especially for the case of district or for the field of district heating and cooling schemes with new business models, legal aspect and policy instruments. Next.
So take some time. So in terms of the different digitalization processes or digitalization concepts, maybe you have seen this picture as which comes clearly from the electricity side. So we can have or we have to divide or subdivide our efforts in different domains from the generation of energy or heat in our case and along the energy chain to the customer to the customer side we have the different zones from the process field and via the enterprise level to the market level in higher zones. And we have the different layer here from the component level communication level up to the more abstract business level. So what can we do? And I think our efforts are some of dots in this three dimensional.
Figure here. And since we are just until now a smaller group here, we are quite many participants. But our group consists for the moment of about 30 participants. We have to focus on certain areas where we want to put in our efforts and what we want to do next. What is our focus area here? So I think clearly our focus will be or is at least primarily on the real time operation of district heating and cooling schemes and to optimize the real time operation which includes also this idea of predictive maintenance check what's happening in the grids and to increase the efficiency here in the grids. Next. In direct relation, of course we see that we have big chances in planning or to support planning procedures for our assets or for our grids which are more and more digital. This planning. Next.
But certainly.
The third focus area is of course the implementation of new digital business models and processes where we have this idea of different services to the customer or different handling of the different processes within the district heating and cooling industry. Next. And of course all these three are interconnected. So these are our focus areas which led in our discussion in our annex, in our activity to a working structure. Next.
So we have subdivided ourselves in five different subtasks where you're invited to join and to have an intense discussion with different experts. So we have.
On the technical operation, we have the digitalization of the end use of the of the consumption side. We will hear a presentation from Sven Svensson later. He is also the subtask leader here and one of the key actors in this field. So what relation we have in a foreign optimized district heating grid? So what is the meaning or the role of the buildings in there? We need to have good operation of the building side, of the demand side to make our grids more efficient. So we are especially designating subtask A to this task. And we have subtask B about the digitalization of infrastructure. This subtask is led by Ralph Roman.
So taking care of the question about the digitalization of the grids and how to optimize these systems. Also touching this idea of digital twins which we will hear in the last presentation. For the first block. Then we have subtask on the digitalization in a system perspective led by Dirk van Hout from Vito in Belgium, taking care about the more holistic perspective and SAPTAS D which is currently supported by Bastien Jensen from Kamstrup and Hei Gutter from the German Heat and Power association about the digitalization of business processes. And of course last we have these dissemination management of the entire activity which is led by us. Next. So we have related ideas and I would say problems to all these different working fields and subtasks for the. For the building fields. We see clearly this issue about data collecting, data collection, monitoring. For the infrastructure we have this idea about simulation and digital twins on the system perspective. Clearly this problem about holistic optimization, analytics and for the digitalization of business processes. We also include this idea about collecting case studies and legal aspects. Next.
So as Ralph Roman mentioned, we had yesterday we had our second preparation workshop. Our first preparation work happened in Copenhagen at DTU. We were about 23 participants from seven countries. Next.
So we are an upcoming activity. So we had our second preparation phase meeting yesterday also as a web conference with about 30 participants and with growing interest. And we are very lively group and we would like also to welcome more participants if you're interested. Next. So we are not working only on our own level, just on an IAEA level. So we have a close relation to industry associations as the German Heat and Power association is supporting SDHC Newborn Power is supporting us and the Danish Board of District Heating. So we are quite happy to have support from this industry organizations here and also within ia. We are seeking a close collaboration from also to the TCP of energy in buildings and communities here in particular to the upcoming annexes on demand response of buildings in DHC networks and to the annex of Data Driven Smart Buildings. And we are also looking for more initiatives around NDIA context. We know that there are more. There's also a similar ongoing, I think actually now from the heat storage implementing, not implementing agreement TCP which is also of interest for our activity. Next.
So we are, we hope that in September we are Able to travel again. So we are having the 17th International Symposium on District Heating in Cooling in Nottingham. Here is a safety date from the 6th to 9th of September. We still hope that this event is of course happening next.
And we are planning here our first real annex meeting with the first working meeting and of course again an industry workshop like our workshop we're having today. Hopefully not only as a web conference. We hope that we are able to meet in person there next. So I'm quite happy, if you have any question to contact me or Ralph Roman and check out our initiative. Thank you very much for giving me the opportunity to present the TS4 to all of you. Thanks.
Yeah, thank you, Dietrich. I really like to really like the group of people that is joining. Kind of coming people from different fields of district healing, also from the digitalization area to get something going in that quite diverse field and really optimistic to have a good team here. Yeah, we have opportunity now for some questions. So if you have some questions to Dietrich or.
On the Annex TS4.
Then please.
Put them in the chat window. One thing I would like to mention that the participation is there is no money, there is no central money involved. So the funding, if you want to participate, the funding need to come from your own projects. So very typically the participants in the annex have a national project or Horizon 2020 project or similar where they have some dissemination activities where they can put the annex participation inside. Some countries like Austria and Denmark and I think even Sweden have dedicated programs for doing the funding. And so they is able to ask for funding in these dedicated funding calls. That's just some additions from my point of view.
If you have any questions. But I don't see anything in the chat window.
No questions for Dietrich so far. So everything seems to be clear.
Thank you very much from my side, giving me the opportunity to present and hope to see some of you again in near future.
Perfect. Then we're going to switch to the next presentation.
Then we're going to go to Sven Svensson from the Technical University of Denmark. I saw him already in the attendance list. Are you here? Are you with us, Sven?
Yes, I'm here. And good morning to everyone.
Perfect. So the floor is yours and you.
Are going to show the presentation.
Yes, exactly. So if you give me next slide, I will gonna switch then to the next slide.
So if you can go. So this is my presentation. I'm Sven Svensson, Technical University of Denmark and the focus of this presentation is you of heat cost allocators meters to improve operation of heating systems in buildings. Next Slide please. The background, just to get the background set is that we can have a district heating system today operating with relatively high temperatures because the heating systems in the buildings are operating in higher temperatures than really is necessary to provide the comfort temperature of 2022 degree in the rooms. And this is because we have for many years been designing an operating heating system based on a focus on the comfort temperature and not really addressing the need to lower the return temperature because that was not necessary earlier. So next slide please. But today we have a new situation in two ways. We need to change our energy systems to be fossil free and we can do that in a very cheaper way. If we make use of district heating and especially if we can lower the temperatures in the heating system in the buildings, then we can lower the temperatures in the district heating networks and then we can make use of low temperature heat sources like waste heat and renewable energy which is much more efficient when they have to supply energy at lower temperatures. The other part, which is a new situation, which is a positive development is that we are getting a revolution that all the energy meters we are using for the billing of heat are getting digital and wireless. So now we can get signals from those meters that earlier was just read manually once a year for the energy build purpose. Now we can get them without extra cost to be read every hour. So we can easily get hourly values from these energy meters and we can make those measurements available online. So this is a very positive situation and that is why we have a potential new solution that we can change the operation of heating systems so they can be operating with a lower supply and a lower return temperatures by use of those online data which has not been available earlier. Next slide please.
So the methodology to implement lower temperatures in heating system is a two step method. The first step is to find the actual operating temperatures and calculate estimates the potential possibility to lower the operating temperatures. To do that you need to pick the data from the energy use which is available from the district heating meters delivering energy to the building. And you can take the. But you can also get the average return temperature from those digital meters today. And you can, if you don't have a special sub meter for the domestic hot water, you can subtract the domestic hot water part due to the summer operation. Then you can take from the heat cost allocators. And for those not familiar with that, a heat cost allocator is a small device which is glued to the upper part of the radiator in each radiator in the large building. The heat cost allocator Measures the surface temperature of the radiator and the room temperature. And the temperature difference indicates a.
Heat output of the radiator to the room. These was earlier read manually once a year, but today they have been transformed to be electronic digital wireless communicating devices, which can therefore be available on hourly basis with the same transmitter system with actually no extra cost. Then you have the.
Companies who are installing those heat cost allocators, they need to register this actual size of the radiators in buildings, existing buildings today, you may have an uncertainty about what is the heating capacity of the radiators. They have been designed maybe 50 years ago and changed sometimes. But when the company having the heat cluster locators installed, they will automatically register the actual size of the radiators. And then you can easily get these actual data. And the last thing is the heating degree days from different temperatures. You can get that from the meteorological service. So the next slide we will see.
How you can use these data. So here we have a graphical illustration. So on the x axis you have outdoor temperatures from minus 12 to plus 12 degrees, representing the design situation up to the end of the heating season. On the left Y axis you have a temperature scale which is for the supply and return temperature curves. The blue one is the supply and the red one is the return temperature. And you can see that we start for the design situation with a 70:40 situation. And then when we have lower heating load, we can narrow down the temperature difference with the same pump flow. And this is calculated based on the heat loss and heat demand of the building. So this way we have for the use of the data for the building, we can estimate what is needed really, what is the minimum needed temperature to supply the temperature.
The right Y axis is the energy delivered and that is the green columns. So here you see how much energy is used at different outdoor temperatures. And of course we see that we don't have any days, full days with a minus 12 degrees. So the design of the heating systems is very, very conservative. So we have a very oversized heating system compared to what we typically are using of heat. And that is why we have a very good opportunity to operate the system with lower temperatures than the design temperatures. And that's very important to remember to stress this. And that results in a average.
Return temperature of only 31 degree. If we then compare that with the measured average return temperature which was in the actual building, 43, we can see that we have been able to lower the return temperature. There's a potential to lower the return temperature by 12° just by lowering the supply temperature to the very minimum. And of course, this is based on the ideal situation that the control of the radiator system will work perfectly. But this is the potential and that shows that there's something to get out of this. So next slide we will look into.
Oh.
Sorry.
No problem.
So here we have the step two of the method of how to implement low temperatures in heating systems. So the step two is to find and fix the errors in the heating system.
Because we have to realize that in existing heating systems we typically have a lot of errors. We have the tenants using their radiators incorrectly. We have a number of physical problems listed here. We have design problems maybe also. And.
The benefit now is that the service person who is responsible for making the operation better, he has a lot of difficulties to actually see what is going on in the buildings. That has been the situation. But today he can get a lot of help from getting data from the heat cost allocators and the extra temperature measurements we can add using the same concept. So for the next slide we will see.
So can you switch to the next slide, Ralph? Yes. So here we have the basic problem with control of radiators is that the tenants very often do something which is not the ideal operation. They tend to use only few radiators or they tend to turn them on and off. And that's because they still believe that this is a way to save energy and cost. But the result is that a few radiators are delivering all the heat. And that's possible if they get a high supply temperature. So when somebody complains in the building about comfort, the easy solution for the service person in the basement is to turn up the supply temperature. So therefore, the supply temperature typically is quite high.
Much higher than actually needed due to the actual actual outdoor temperature. And this way, the pure radiators add to the comfort temperature, but the result is that they deliver a high return temperature. So we don't want that to happen. So we need to accept that we have to go back and train the tenants to operate the system in a better way. And if you politely ask them to do this, the experience is that it doesn't really work. You have to stimulate them in a much stronger way. And the much stronger way is to turn down the supply temperature to the minimum. And we can see the possibility of that on the next slide.
Because in this building we are going to implement this. So this is a case where we have an actual building, 42 apartments and 250 radiators, all having the heat cost allocators it is quite well equipped. It has thermostatic radiator valves with presetting function to balance the flow. And.
We have.
A measurement where we can see how we can make use of the heat cost allocators from.
February, just an example. So for the next slide you can see how we can take the signal from the heat cap cost allocators. Every hour or two hours we get this. The top of the curve we have the supply temperature from the central.
Meter measurements. So this is 55, so this is still relatively high. So we haven't started to lower the supply temperature. And at the lower part of the graph you can see for each room there is a estimated calculated return temperature based on the signal output from each heat cost allocator. So in this way we can see that in this flat the thermostats are probably set quite well, all of them. And all radiators are then.
Delivering some heat to the flaps and delivering a very nice low return temperature most of the time. But if you go for the next slide, you can see that very often you have this situation that out of five or six radiators, only two are actually in operation. The rest are totally shut off. So this is an example where the radiation user have this idea that he will save some money by only turning up the two radiators. The consequences unfortunately, is that you can see the green one is very close to the supply temperature. So water is running into the radiator at 55 and out of the radiator at 50 degree. So very little cooling and a very high return temperature. So he thinks he's going to save energy, but he's using the same amount of energy from one radiator or two radiators. And he's resulting, his bad operation is resulting in a high return temperature. So he's actually getting a penalty payment from the district heating company due to this wrong operation of the system. And this is what we want to see. And then we can turn down the supply temperature. Then he needs to open more radiators to get the heat in the flat because only if all radiators are turned on, he's able to get the comfort temperature. And as long as he don't turn on all the radiators, the janitor can say, but if your temperature is too low, it's because you haven't opened the radiators. And automatically if people don't get the right temperature, they will start opening all the radiators. So this is a more robust way of teaching people to turn on all radiators and leave them turned on. So for the next slide we can see more problems that can be found in real houses. So this is a tenant who kind of have this idea that he might control the system himself by turning on and off. And the result, of course, is that when you shut down the heating system for some time and then you turn it back on, then you get a high return temperature and pulses in the need of heating. So that's not a good way to do it. And that will also be eliminated if you can make the lower the supply temperature to the minimum, because then.
The.
Tenant needs to keep the valves open all the time. For the next slide.
We can see the last example of a tenant who is also changing things arbitrarily. And of course, you can see the red curve is very high, but one of the radiators is almost as high. There is some uncertainty in the calculation of the radiation return temperature, but it indicates that this is fully open and heats together with the green one. The flat and the rest of the radiators are not really used. So for the next slide.
We can sum up and say, okay, if we implement the low temperature operation of the radiator system, which is what we want to do, because then we can make sure that these errors are eliminated. Then the return temperature is of course as low or a little bit lower than the supply temperature. And we can do that according to the curve we found from step one. And when we start doing that, it's very nice to have this information about how are the different radiators actually working. And some of them may have some physical errors. And of course, that's where you need to go and solve the problems as a service person. So I think it's very important that we get back to getting the heating system serviced correctly. So all radiators, all thermostats are working correctly. And the system for distributing heat between the rises, of course, should be balanced. And we can much easier do that if we have this insight to what is going on, what are the temperatures, what is heat output from different systems. So in this way, we hope that we can make use of the data from these digital wireless heat cast allocators, not only for billing, but also for improving in easy way the service and fix the errors we have in the system. And for this next slide.
We have to, we have to always remember that we have a technology that may help us do something better. But the technology solution is not alone enough. We need also to have economical stimulation of doing this better operation. And the economical stimulation is Simply to say we have two things we have to implement. Motivation tariffs from district heating companies. So they will say if the return temperature is too high, you have to pay some penalty. If you can lower the return temperature, you can get a bonus on the cost of heating. This is implemented in many district heating companies already in Denmark. And so this gives the money to the service person responsible for operating the heating system in the buildings. Then we need to split up the heating bill to the individual tenants so he will pay for the heat he actually has used. But the penalty payment or the bonus payment should of course go to the service company who is responsible for servicing the the operating system. So they need to get economical stimulation to do this. So this I hope will be the two step methods and the two way of making economical stimulation of the methodology that would make it possible. And the interesting thing is that this digital meter is going to be implemented all over Europe in the next years because it's part of the Energy Efficiency Directive as a mandatory thing. So the final slide. I will just.
Say that this was my presentation and if you want to cooperate in this work, I would very much welcome you and please contact me and then you can do that within the IA task TS4. So thank you for your attention.
Yes, Sven, thanks a lot for your presentation. I think that that is a very important point you're raising with your work. Sorry, with work in Subtask a of the TS4, the interface between the customer and the energy system. And together with what you mentioned at the very end, we see increasing digitalization giving a lot of opportunities for being obviously for changing. On one hand, a lot of people talk about demand side management, that the building heats at a certain time when energy is better available and it does not heat when energy is very expensive or only fossil. But on the other hand, the point you're mentioning or you're raising to increase the temperature, to decrease the temperatures in the system, to increase therefore the efficiency. It's a very, very much underestimated point. That is, there is a lot of awareness for that point from the district heating companies, but it's quite difficult.
And this is. And I see already a couple of questions incoming.
For this point. So the first not question, it's more common from Webo Crown.
That is in the chat you see a link to the article what would have been written on the system that has been implemented in Vborg and that has already an effect. I'm aware of the system. I think it's an interesting case study. Recommend everybody to check this article and there's some questions from. First one from Vina Neg. How much is the penalty bonus payment on the overall bill? On our calculation the service and network costs are really already dominant over the energy cost even without penalty bonus part, can it be attractive for saving of €5amonth for example, for a tenant? Sven, if you would like to answer that question.
Yes, I will clearly address the link Tom sent for his because he is have implemented this system in his district heating network in Vibor which shows very well the system. So please read that. But about the Generally, if you want to change as a district heating manager, if you want to change the system for the future and you know in some years we are going to have renewable energy and it would be a big benefit if we could lower the supply and return temperatures before we have to implement those systems. Then in principle you can introduce a penalty bonus tariff as a kind of a neutral system that will turn down the temperatures and give the customer an economical initiative or interest in doing that. The typical value used In Denmark is 1 or 2%.
Of the cost.
And that results in many buildings in quite large extra bills. But of course.
You have a limitation. It's not so much that you can renovate the whole house, but the system here is that you don't need to renovate the whole house. You just need to get back to operate and service the heating system as you should. Actually as a service service person of the building already have been doing. And just to correct those small errors do not cost a lot of money. So I think it's technically and economically feasible to realize that. But as a district heating company you could even have higher bonus penalty tariffs percentages. If you could have 5%, that would stimulate this more. And the idea would be that you could kind of have a balance between how much you get in bonus and how much you pay in bonus to customers and how much you charge those who have too high temperatures in a penalty payment. And that would stimulate the change of the system.
Thanks Fred. I just noticed it's already quarter past 11, so we are already a bit late in time.
I would close this presentation for now. Just make one remark to the Austrian participants. We have. There's a national project, it's called T2 Low X. It's an Austrian project where we look at these kind of motivational tariffs and other measures.
So that is just a hint for the Austrian participants. So Svend, again thanks you for your presentation. There's another question. I'm afraid we are already, as I said, we're already late. Herbert, I guess you hear me, we will make that question maybe afterwards. Directly.
Exactly. So then gonna switch to the next presentation. That is then my colleague Benedik Leitner. We're going now from the building a little bit more to the district heating network as such.
Thank you.
Floor is yours. What's happening?
Hello to everyone. My name is Benedict Leitner and I'm really pleased to talk to you today about optimization of district heating networks using digital methods and twins. It's actually quite nice to use digital methods for presenting digital methods. So just as a side note.
I'm also involved in subtask B in the Annex TS4, which is digitalization of infrastructure. And today I will talk a little how we see things at the Austrian Institute of Technology.
AIT is Austria's largest research and technology organization. We have over 1400 employees and are partly owned by the Republic of Austria and Federation of Austrian Industries. Next slide, please. We have various topics of expertise at AIT and one of RALPH and my main topics is district heating and cooling, where we basically analyze different decarbonization strategies for district heating and cooling flexibility and hybrid networks. That means also interfaces to other networks, especially to the power sector, to also enable flexibility for the power sector, but also for the district heating network and to have a closer look on efficient and low temperature networks. Next slide, please.
The main focus of my talk today will be digital twins for district heating and cooling. So maybe as a, as a starting point, what is a digital twin? It is somehow a virtual replica of a physical system.
This is, you can use a digital twin basically for various of different use cases.
Being predicting the dynamic system state or for visualization. Visualization and also virtualization. When you think about augmented reality to enable maintenance, for example, or training of course, in general for the decision support to optimize operation and control, for fault detection, predictive maintenance, or for standard scenario evaluation where you analyze what if we install for example a larger thermal storage tank or another generator, or what if we lower the supply temperature.
So the specific use case that you select basically defines the level of detail and the approach that you might use for creating your digital twin. So this is not a straightforward thing and this is also not something that is standardized in any way.
But today I will present one method or one approach that is focusing mainly on the energy technology point of district heating networks. Next slide please.
So one key point you might have in mind when you think about digital twins is what is the exact difference of a digital twin and simulation? So there are some similarities, but there are also some striking differences. So one being that a digital twin normally receives real time data from its real world counterpart.
So this allows the digital twin basically to become active and change dynamically based on the operational data it receives from its physical counterpart.
Another thing is that digital twins are normally thought of being multi domain. So that means that digital twin does not only focus on one domain, for example energy related data, but also for storing business data. This allows cooperation between teams with traditionally different foci. And it also provides a unified repository for different kinds of data for the same system.
Another thing is that digital twins.
Can work together. If you think for the case of district heating, you have maybe a digital twin for the network. You might have a digital twin for for buildings or for generators. And these areas are normally operated by separate businesses or corporations, but they can work together via the cloud or via different IoT platforms. And this also enables basically collaboration among normally separated businesses. So in the example I want to present today, we use Motelica for detailed dynamic thermal hydraulic simulation of a district heating network. You see here example of a smaller network where you have models for a supply unit for the pumping station, a decentral supply for each supply and return line for the different substations and also for buildings.
Next slide please.
Multelica is a very nice language. It is an open language for dynamic modeling. It is equation based and uses differential algebraic equations, which is very general.
It is object oriented, which allows us to reuse and extend different models. It is itself already multi domain. So it you can analyze systems that are mechanical, electrical, hydraulic, thermal, but also control systems. There are a lot of model libraries available, all proprietary ones, but also open source ones with a lot of validated models. Maybe the only downside I can think of is that it has a quite difficult translation process behind, but this is normally not something that the direct user is is concerned with. Next slide please. At ait, we use this Metallica language to create our own distribute heating library which we made open source. We use the excellent open source library EPIPSA.
For having validated models for valves, heat exchangers, pumps, etc. One main problem for creating the library was the heterogeneity of district heating networks. So you have a lot of different kinds of substations, controllers, valves, etc. Next slide please. Here's an example of how this model look like. We have pipes.
That represent transport delays or heat losses to the ground pressure.
Drop. If substations with different hydraulic schemes, you might have a direct substation or an indirect substation, including electric booster, heaters, storage tanks and other Details. On the secondary side, we can have different producer generator models, both centralized and also decentralized supply units including pumping stations, storage tanks.
And controllers.
Next slide please.
This is an example for the level of detail you can achieve using these models you can have at an individual substation. You can have information of the actual supply temperature, the mass flow at this substation, but also differential pressure. You can have information about the temperature in the different storage tank layers.
So this allows quite detailed look at individual components, but also on system level key performance indicators. Next slide please.
This is very nice for modeling district heating networks using physical models. But of course district heating networks are not separated by or they have some boundary conditions or boundary systems. You might think of interaction with the power system. You might think about interaction with buildings. You might want to test a controller in the loop or hardware in the loop before you deploy it. In the field, you might have advanced control scheme that you want to test with your digital twin, or you want to use data based models, for example to replace some of these physical models in the digital twin. Because you might not have enough information to create a physical model, but you have enough data to create a data based one.
Next slide please.
At ait, we try to include as much of these boundary or system boundaries using different tools that are coupled with the functional mockup interface, which is a standard to couple different tools and modeling paradigms.
This allows us to cherry pick basically which kind of tool we want to use for which domain for the power system for buildings, etc. I have some examples at the next slide.
For example, we use this for paused system analysis integrated in the district heating network analysis. If you think about distributed heat pumps or electric heaters, or combined heat and storage combined heat and power plants, you might want to analyze the impact not only on the district heating network side, but also also on the electric grid.
We use different tools Power Factory as a proprietary one, but also the nice open source tool Panda Power. Next slide please.
For the building simulation, we can interface our district heating network simulation to different kind of building simulation tools like Transis Energy plus, but also Motelica directly.
Which allows us to study the impact on different buildings and also their impact on the district heating network. If you think about lowering return temperatures, what we heard in Sven's talk before, for example, and you can really integrate this in one larger model than. Next slide please.
You can also test different control strategies on your district heating network before the deploying it using rule based or model predictive control, but also more advanced machine learning based ones using reinforcement learning for Example.
Next slide please. So there's a nice interface to Python and matlab, and one especially nice approach is replacing some of the physical models. So if you are a district heating operator, you normally have quite detailed data of your network and of the different assets in your network. But you might not have access to data from different or detailed data from different buildings to create the physical model. But you might have demand data.
Which allows you to create data driven models using machine learning algorithms, for example, and you can combine them with detailed physical and validated physical models.
Next slide please.
So this was basically.
Our view on district heating or digital twins for district heating and cooling networks. There are still quite some challenges and open questions concerning digital twins. For example, it's not that obvious what kind of modeling tool you use for a specific use case.
Or what kind of models. So there might be actually different models for the same component, but for quite different use cases. If we think about.
The engineering perspective and the business perspective, there might be completely different models applicable.
Also, the model complexity really depends on your use case or on your application, but also on the data that is available, which might be limited.
Updating and long term maintenance of digital twinning software is also still an open question how to update this kind of software during operation. There's also still a lack of experience in how to employ different use cases, how to set up and operate a digital twin for district heating and cooling networks. And it's also at the starting point, quite unclear what the monetary value of a digital twin is, which makes it even harder to.
Go for it. Next slide please.
But what I want to state is that it might be worth tackling those challenges and to have a deeper look into digital twins for distributed and cooling networks. I just want to.
Name a very prominent example from the automotive industry. Tesla, for example, has a digital twin in each of his vehicles.
Which delivers basically real time data to the manufacturers. And you can analyze.
The impact of different user behavior or different hardware and software on.
The different vehicles, for example, and this data is directly available at the manufacturer.
So thanks a lot for your attention and I'm really eager to discuss some of the points with you in the discussion. Thanks a lot.
Thanks a lot Benedict, for that presentation. We are actually a bit over time already 11:31, so I see already four people leaving. But I see on the other hand still some questions coming. There's two questions. 1. Marcus Gollus Best, Austria about the complexity of the models mathematical structure has a model for a pipe 2D partial differential equations 1 heat or momentum? Is it one, two or three dimensional models.
So again, I want to stress that this was an example of how you can model a digital twin. Definitely, as I said, the use case of the digital twin definitely defines the kind of models or the detail of the models that you might use. In our case, for the Motelica models I showed, these are normally one dimensional models that have both equations for the thermal as well as for the hydraulic domain.
Hope this answers your question, but as I said, there might be different use cases where for example a more detailed CFD simulation is applicable or where you don't really need a technical simulation but rather.
The business side or.
Yeah, okay, glad that it answers your question.
Okay, perfect. Then there's a second question from.
From Mindaugas Valenci. No, I don't see it anymore. Just a second.
Yeah.
How Motelica is ready for larger systems. More specifically auto generating the model from his data.
This is a good question. I think Motelica itself, as it is only the language, the modeling language is quite ready to.
To create larger models.
I agree the translation process or the simulation tools might not be that ready to handle like really large district heating networks. I mean there are different methods that you can use to circumvent these problems. For example, employing parallelization or reducing the complexity of your network if this, if this is applicable.
But in general you can auto generate a multilica model directly from example given Python script.
One small comment from my side. The challenge what we saw in the past doing these automatically generation from GIS data. What you ask is that very often GIS data is not very well done. Since for a GIS setting if you want to have a technical drawing of a pipe of a network, it doesn't really matter if the pipes 100% match. So if the ending point of two pipes 100% match. So if you draw two lines and they more or less match, you don't even see that. Obviously if you do a computational model, if there's a micrometer distance between those pipes, just in a comma, certain amounts after the comma, certain zeros after the comma, it matters because then it's not connected. So doing these kind of connecting the really connecting the lines. There is some automatic methods for that in JS operation, but it's not that easy.
Yeah, there's some other questions but as on the complexity. But since we are already a couple of minutes over and I see people already leaving, I just want to maybe Markus and Benedict, you can have a direct chat together afterwards. Marcus is anyways aiming to participate at the TS4 so we have good connection here.
And so I would like to try now the experiment with making just always says under other slides no question answer to presenters. We have. So let's try to make this experiment.
On.
Having.
Having. Having a shared. Having a shared group photo. If there's not any other question. I mean we might have room for any general question, but as if we are already a bit over. So if there's no pressing question we can maybe also ask in the second part.
There is another question for the complexity. Again.
Again I would suggest to discuss that question either later today or in the break. So maybe I can provide Benedict's email address or you have it. Maybe I could just put Benedict's email address in the chat box if that is okay for you, Benedict.
Of course you can maybe just directly ask Benedict these points.
On the digital twin presentation. Now let's see if we can make a webcam. I think you're not able yet to turn on your webcam.
Yes, we are.
You are?
So then I enabled this function.
You enabled it already. So then let's try what we can get here now.
I don't see anything at the moment. Don't see anything.
I don't see anything at the moment, I guess. Can you see things?
Yes, you have to click view everyone.
On top of the screen. You have a very small.
There's a message maximal number of webcams is reached.
So maybe it won't work out at all.
Yeah, I was afraid that 100 webcams doesn't work.
At least we see a number of people.
We have 25, I think.
Hi everyone.
First 25. So I still. I don't know what is my. With my web, with my go to meeting. I'm missing the overall screen.
30. Okay.
Maybe someone.
No problem.
We can hear each other.
Ralph, I can take a screenshot if you want.
You can make a screenshot. Perfect. So then those who are in, let's smile to the webcam please to see the screenshot afterwards.
One, two, three, smile.
Okay, thanks a lot.
Perfect. Wonderful.
Very good. I'm really happy. That went well. Was not as interactive as I thought as I was difficult with 100 persons. But I hope the next session we will have a bit more interactivity at the very end we have a bit less presentations, a bit more time for discussing challenges on these different levels that Michael addressed.
So I'm happy to see you all in about one hour. I think we start again at.
Have a break. We have a break now? Yes, we have one hour break. We're going to start again.
So there's an option for testing again at 12:30, testing the technical connections. But we're going to start at 1pm Central European Time.
I will repeat a bit of the things because we might have some new people. I will repeat a bit the. The etiquette and all these things.
And really looking forward to how to make it, how to. How to discuss these challenges and opportunities in this big group of people. So have a good break. Malzeit, you say in Austria, that means translated good time for it.
See you then. Bye bye.
That.
This conference will now be recorded.
I forgot about the recording. So welcome to the webinar on digitalization of District Heating, including Block two. We had a first webinar this morning about the Eranet call and the annexed TS4 and this webinar. Now the overall idea of the webinar is to discuss from the more academic sides of solutions, from the industry side solution. That is the second part that we have today that we have in the afternoon. But very important also to look at the challenges of digitalization more from a research perspective, since.
There is a funding opportunity, the Eranet call on smart energy systems that is going to be opened in September and had. Will have a deadline in, I think in December or January or something like that. That is not yet clear, not yet fixed. And there is participants here in the room that are from the funding organizations that are looking for possible things to put in their text. Obviously that will not go in one by one, but a lot of things will be here.
I think we are quite complete now. I will now go to the.
Slides.
So here we are. So first of all, you might have heard that this webinar is recorded and we will make the video file be available after the webinar together with the presentations.
So you will get all the information in a later stage, maybe not tomorrow, but I guess maybe within the next week. We are able to give these information.
Some very basic information for this webinar. How to participate. The first part was very successful. So what we did, we by default muted every microphone. Obviously if you want to talk, you can switch it on. But we tried, obviously. Please make it in a way that only one person speaks at a time. If you want to talk, you can put in the chat a message request to speak. So rts, you can type in. You can also type your question directly in the chat. So we will read it out loud. The moderator will then ask the speakers to speak, if they are, if that is appropriate. And also please state your name and institution before you speak. And also if you type something in your chat message. Sometimes we only see your name. There's no institution. So that is maybe giving a bit of context to the, to the participants. We by default turned off all webcams also to reduce bandwidth. We tried to put it on but it wasn't really working at the, at the end. But what, what worked for the last time, make a group photo. However, GoToMeeting doesn't allow too many webcams turn on at the same time. So we had only 25. So I thought about this time that we make.
Kind of a sequence so that the first 25 turn on the webcam and they turn it off, then the other 25 turn it on. And so also hopefully we can manage to get 100 webcams turned on to see all of you. I just say that at the moment obviously if you don't want to turn on your webcam and don't want to be seen and remember it is recorded and we will send out the pictures of the webinar and if you don't want, obviously you don't have to. But if you want make sure your background is appropriate. We are all at home, I guess so but we all have understanding if there are toys or your, or your bedroom or something in the background. You don't need to arrange books to make look. To make you look intelligent. And coming to the next point, caution with humor and sarcasm. I'm just making some jokes but the obviously the effect might be lost between the lines. So yeah, especially if you type in a chat that might be difficult to understand the agenda for the second block. Don't want to go too much into that details. So as I said we're going to go more on the industry side have some solutions from Samsung, Danforth and Gutter. Beck is talking in behalf of Schneider Systems and Noda, a Swedish engineering firm that offers digitalization solutions. We will have question answers to the presenters directly after the presentations.
And we will also. And then at the very end we will have an open discussion opportunities and challenges for digitalization District heating and cooling Open discussion discussion in. I mean as I said it's difficult to get hundred people having a close direct discussion. So we will have an online tool for enabling you putting questions into the online tool and then we all will be able to see these questions. They are posted anonymously so we will not see who posted the question or who posted the challenge but we will have a list of all of them that is very helpful. Then maybe if you want you can highlight some or we can see how we can discuss discuss these challenges? I split these discussion points into three points. One of the questions will be what are the most important challenges regarding the technical operation of digital solutions or the communication interfaces you have in between? We talked about digital twins for example as well how to implement the non technical side all the smart meters or the optimization algorithms. Second question will regard to the market operations boundary condition. But are there any for example overall ICT platforms that enable digital solutions? What is about the GDPR when it comes to data? Are there other general boundary conditions that are challenges that should be tackled? Maybe taxes, subsidies.
Electricity tariffs and these energy prices is more district heating specific challenge. But we are here now discussing the digitalization challenges and last point will be the business opportunities. So what is about business models? For example, how to involve stakeholders or this added value of digital solutions. So these discussions we will discuss at the very end. I put them already on here so you can already think about these three points. Technical market conditions and business.
So the one is very detailed, one is more on the overall level and this, the last one is more with your. With your. The customers, the clients and other stakeholders that are the. You can already think about these three points, what kind of challenges you see and you can then later put it in the. In the. In the online tool. Yeah. But now without. If there's not any. Any questions to this procedure. We go with our further ado to the first presentation of today. That is from Samsung District Energy Energy Savings with digital solutions for Martin Bruzau.
Are you with us? Martin?
Unmute yourself.
It's a soft muting.
Yes, if you open the.
And I think you wanted to present from your screen. Yes, yes, just a second. I need to find you in this long list of participants.
Martin, here you are. So I can make you a presenter. Yes.
Thank you.
You should have presentation rights.
Yes.
Tell me when you can see it.
I can see it.
Okay. Good afternoon everybody. First of all, I hope you and your families are all in good healthy shape. I think this is very important at these times.
Today I want to present our SAM District Energy system to demonstrate on one sample how for example the flow temperature can be reduced already without new regulations and so on. So to give some ideas what's already possible.
Okay. Some District Energy is a cloud system which is used for visualization, operation and analysis of the existing network down to the substations in the houses.
When we look for the application.
There are different ways to do that and for us it is very important to have a relative.
Fast connection and are able to frequently transfer Data. So we do not like to see data only once a day or once a year or in long distances.
We want to do something in the system and want to influence the control of the system. So that is very important to have frequently a feedback from the situation in the network, from the data. So we have three options for that. One is a little small Samlan. It's an integrated network in itself, which then is connected to the main network or via a mobile system, or at least some home is just an ethernet standard router system to be connected to the system. And what we are connecting are controllers, utility meters, actuators, differential pressure data and pumps. So at the end of the day we read out the data and already do act on the systems in the network. So these systems or the cloud is connected to the interface to the customer server.
One of the tools we are using in the network is our heat map. And the heat map for me is a very important thing. One is you get all the collected data and do the analyzes all in algorithm and do automatic control and all these kind of things. But we are all human and it is very nice to have an overview about what's going on in my network. So therefore, for the whole installed base you get an idea where are the hotspots? So where are bad efficiencies? So you see red areas where you then zoom in and see actually the situation in the moment, under more or less real time to see what's going on in that area. So doing that you can look directly on values if you want, or zoom in in the color code. And you also see on a network route plan.
How is your tracking? What about your grid? Where exactly is it? Which pipes are involved? So you see on just one window all the current status of your network and can interact with it.
So which systems are connected? For example, you exchange data between sensors, for example, a weather sensor. You can use just one install outdoor sensors, control based differential pressure valve positions, all these and we influence directly into a controller if it is connected in the system. So that you still have the individual loop for your building, for the sub station, but you can influence straight into the controller, give a different set point or influence things here to open or close the valve. So if you want to shut it down, you can shut down just a couple of regulators or all of them. You can also just summarize.
One one area and shut them all together. So you can select whatever is required. So you can do or can generate digital virtual substations by summarizing just a couple of them.
And of course finally, the network pump control is important for you for analyzing or to interact in the system.
So another screen which is very nice is for the analysis. You look at the primary flow and return temperatures. We did hear that in the morning in the presentation already how important the flow and return flow temperature is. And you can analyze it. You see straight away what is the current flow, what are the current conditions. And you can analyze every single substation if you want. Or as I mentioned, you can combine a couple of them just in one. And so you can do troubleshooting straight away.
On the Internet connection.
You can use just a mobile phone or lan, whatever you want to use with it. You can just check the connection of the system to the meter and so on. This slide is not so important.
And the most used element on the network currently is the mobile gateway wireless connection using the integrated modem. And you connect controller, actuators, modbus just on emboss universal device. And you can read it out or write to it. This is a good solution for already existing plans where you are not able to.
Just have a LAN system straight away.
So let's have a look at the added values.
You analyze the water flow, you analyze the roots by tracking the large changes of temperature. So what you can already influence is your hydronic balancing in the main system. So you can use the analyzed data to ramp down pumps or temperatures.
The analysis of flow rates you can do along a pipeline section or an area, as mentioned before, record that. And then you can do your simulations if you want, and can act on it, so you can identify straightaway poorly balanced zones and act on it.
And.
You can use the network pumps for more.
Readings and actions. Or you can add additional pressure sensors in it where required. So if you see in your system you have bad areas, you may think afterwards I should just install an additional pressure sensor there, get it back in the system. And you already have additional analysis of your whole system.
Just as one sample, what can be done without.
Really influencing on the building itself, which of course is very important. But for the moment, as we don't have specific rules that, just one sample, where we have installed in one project 1,000 units. And in that particular one we only connected the heat meters. So we did read out all the heat meters, not the controller and so on, which will give you an additional.
Chance to get to influence and to reduce the temperature. The main grid was a mix of different heat sources with boilerplans, gas boiler, coal boiler and so on. CHP plants, heat storage and power to heat. So by just continuous monitoring, analyzing and acting on it. The first result straight away, within a very short time was to reduce the flow temperatures of that unit by five Kelvin straight away. So and five kelvin on the main network be reduced on the flow temperature is really a huge energy saving and a huge cost saving.
That's the main thing I wanted to demonstrate today.
Are there any questions?
I see already in the chat room two questions. First one from the Bastian Grim from agfw, the German District Heating association. On the heat map, if the heat map points. If these points on worse efficiency in the heat map means hydraulic issues. So for example, differential pressure are not bad. Or is it about heat losses or high heat demand in a certain branch?
Yes, it is all based on heat usually. So we read it out and for example, the return temperatures are getting up and high or there is a high.
Demand on it, what you can see and adjust what you want to see there.
Okay.
And our second question from Robert Lauder, Wiener, Austria is about.
The buildings. If it's on central heat demand or are you reading the heat demand of individual flats?
Yes, we read it from the individual flat. So we transfer all the data via the gateway from the substation in the building and from that meter we get all the data and read it out. This is what we are doing. So it's not the power plant itself, the outlet. Hopefully I did understand the question in the correct way. We are reading really every single connected house where a gateway is installed.
Perfect.
I don't see any other questions at the moment. I guess you are available. People can have your contact detail. Oh, there's another one also from Robert Lauter is a wireless connection from. From flat to cellar to the basement.
Yes. What we require of course is a wireless connection. So it is a standard.
SIM card which we need. Or we need the.
Connection to your mobile network. If that is not available.
We would have to install kind of a router, a standard LAN network if required. Or we could check individually if something else can be done at that point. But of course it's a mobile network, so you need some kind of overhead mobile signal.
Perfect. In terms of timing, I would suggest to go to next presentation. Thank you again, Martin, for that presentation. And I switch now directly to Helmut Karner from Danforth. Actually, as a maybe not funny, but interesting side note.
We are also we're talking to Dante for Central Danforth in Denmark for this presentation. But they are shut down completely. So all our people don't have to work, have to stay at home. And they're even not allowed to do work related things. Just a side note here. And what kind of are you? I see you're already on. Should I have your presentation with me now so I can share it if you want. I mean, we can also. Yes, just a second. Where we.
Are you with us still?
Yes, I'm here. Thanks for the short introduction. This is already slide two of my presentation.
Maybe first of all I will introduce myself. My name is Helmut Karner.
I'm responsible for business development in Danfoss District Energy, responsible in Germany and Austria. And the headline of my presentation is Danfoss Digitalization in future District Energy Systems where I want to present the new Danfoss digitalization suite of our company.
So next slide please.
In the future, Digital energy systems will enable district energy company companies to fully optimize their plant and network optimization and additionally empowering the customers and end users.
For that. Digitalization enables state of the art.
Control of temperature and flows, interconnecting production plants, distribution networks and buildings, including individual homes in real time. Balancing of supply and demand at any given time. So it's important that digitalization allows optimization of the system and enables remote control.
For that we have to take a look on the demand side as well as distribution side and production side.
Next slide please.
This is.
The digitalization drive changes for the district heating utilities.
Which enable state of the art controls of the optimization. Empowering customers and end users make interconnecting production plans and distribution networks and do analysis of data from networks for predicting the demand of production and do real time balancing of supply and demand at any given time.
Next slide please.
Here you can see that digitalization helps that renewable energies can be integrated in district heating networks. And digitalization is of course one of the most important levers in realizing district energy 4.00.
The curves below. I think everybody knows this temperature went down over the years beginning end of 19th century with more than 200 degrees, then decreasing a lot. Second, third, fourth generation and at the same time the energy efficiency increases a lot. In the meantime we are working on the fourth generation having low temperature levels at 50 to 60 degrees and even in the future fifth generation is in front of us where temperatures will further go down while the energy efficiency should increase.
Next slide please.
This is the district Energy optimization circle.
As we talked before, we should take a look on the demand side with all the buildings on the secondary side, then further go to the distribution network where we have to design and operate the distribution with optimal thermal and hydraulic parameters and at the end to take a look on the Production side to secure that the best economy should work, that those sources are running with the best economy. And then we have to learn out of these informations, do some simulations and verifications and then apply and start the cycle again. This is an ongoing process to improve and optimize the whole district heating network.
Then let's take a look first on the demand side on the next slide.
This is.
A demand prediction and optimization from lean heat. Actually knowing how your customers will behave is the basic for optimal operation of your district energy systems. Meaning that the artificial intelligence from lean heat bring short and long term demand prediction and outdoor commissioning and self adaptation.
In the cloud to have optimized demand sides on heating parameters, optimize the distribution and production to the needs of the demand. And last but not least, do optimization by utilizing building thermal capacity for peat shaving. Here it's important that with lean heat we can learn, so to say, the behavior of a building on the terminal side. And out of this we can do some optimizations which I can explain on the next slide, please.
Here you have to know the behavior of your demand, which is essential to be able to optimize the process. We see on the left side the building with traditionally operated with controller, a weather controller who is having some settings manually configurated, not predictive. And then maybe some changes are done because in one room it's too cold. And then the heat curve will be adjusted, will be set higher. And then nobody takes care anymore. And we have the result, an overheated building. And on the right side you can see the AI controlled building from lean heat where we can use indoor sensor data, weather data and data from district heating network and optimize them. The weather controller that actually at the end we have an adaptive and no configuration slated controller. And also we are predictive to be sure that the energy efficiency of the building will increase a lot.
Then the next slide, please.
A very important part of understanding our demand is the load forecaster.
What makes the load forecaster unique is that it's based on historical data.
As longer as better.
From this digital heating network, weather data and day types, this can be standard days or holidays, Sundays, this is different of course. And then it can predict exactly how the consumption in the distributed heating network is going to be. And combining SCADA real time measurements and online weather forecast data, we can predict the energy usage today and also five days ahead with a minimum accuracy of 95%. And we are having two different.
Possibilities for this forecast. One is the standard forecast which covers the whole supply zone. And Then the extended forecast that divides the heating network into a number of zones with separate energy protection and profiles. And then we can sum it up the total consumption of the coverage area.
A possibility can be, for example, to have zones for industry residential areas than zones where the flow temperature have to be different. And also it's important to consider the transportation time from the energy supply to the buildings. This can be more than some hours. And here it's important to get this information from the demand side to the production that they are able to produce the right temperature level.
So actually knowing how your consumers will behave, this is the basis for the optimal operation of the whole district heating system.
Next slide please.
Then, going further in this.
Optimization cycle, we are coming to the distribution side where we want like to distribute with the optimal thermal hydraulic parameters, which we can see on the next slide, please.
Danfoss Energies.
Is able to build and maintain heating and cooling hydraulic network models. And based on that models we can do simulations indistinct energy distribution systems in general and optimize then the hydraulic conditions in the network.
In order to minimize pumping costs and delivering the optimal set points of the control system in general.
Next slide please.
Danfoss Energies is online operational support module which optimizes in terms of design and investment value, expansions, refurbishments and connections. And new connections makes analysis of impact of the impact of the expansion, refurbishments or new connections for the rest of the network. Which is important because every change in the network has some changes in the rest of the network. And this can be seen and the right actions can be agreed. It also allows development of contingency plans and creates a database of knowledge about the network in general, which can be very important to have right documentation of your network.
Next slide, please.
Yeah, this Energies online tool calculates the optimal hydraulic parameters and apply them gives an overview of the temperature, flow and pressure at any point at the network. And additionally we are having unlimited virtual measurements at node points or pipes. So we're having really a lot of very interesting data from the network, not only for those points where our measurements are done. And then we have an overview of the composition of the production sources at any point at the network. You can see then also arrows that you can see in which direction the water is running. When you are having a complex system with different sources, then it's often so that you really don't know exactly in which direction the water runs. So this is also very, very important. And then you can do simulations of future conditions based on the weather prognosis and can do what IF analysis for daily operating. So when you get some data from the SCADA system, you can so to say, be prepared for some challenges challenges or critical events. Making such what if analysis and at the end planning of interventions with effective execution and quality of services is the last point.
Then next slide please.
We have a new development made called inet. INET is a new Danfoss remote databn flow controller. An actuator on the valve can remotely adjust delta P and afterwards you can fine tune the flow to ensure that you are having the right supply temperature. This is important to align the changes of the heat consumption and make the right hydraulic balance. You know that in a network you are having different changes all the time. Daily changes between morning and evening, seasonal changes, winter, summer, then when buildings are renovated, new windows or new insulation. Because of that you are having a new situation on the heating demand. Then of course network extensions which increases of course the energy consumption in general. And then the source dynamics when you are having different sources which are switched on and off and you are getting new situations in the network. And with this remote setting of the set point of the delta P controller, you can easily adjust to the right level.
Next slide please.
Here you can see.
An example. With inet you can remotely adjust the delta P of branches or at endpoints. And this helps you to handle critical points of your district heating systems and give that the right set point at the end to lower pumping costs and to avoid having too high return temperatures.
Next slide please.
Now we are coming to the production side to secure that the best economy is given so that those sources are running with the best economy, which we will see on the next slide.
To reduce heat losses and primary energy costs in the district heating network, the supply temperature must be kept as low as possible. And based on the demand forecast and the load forecast and hydraulic characteristics of the network, the optimal supply temperature in the network is calculated. In the left picture you can see.
That the red line is the supply temperature before the optimization. And then you have a yellow dotted line which.
Made a safety margin of 5% possible. This is the standard way how district heating networks are often running. And this is just covering the peak which you can see on the green line. And the green line is then the optimized supply temperature. And this green shaded area is the optimization potential you are having when you are having this temperature optimization. And this temperature optimization brings big annual cost savings. As also was mentioned before in the presentation, it allows less maintenance and repair costs of the pipeline when the temperature is going down. Of course some energy Savings according to EU directives have to be done. So this is also one point which is important and especially this temperature optimization brings a very attractive payback time return of invest between half and two years. So this is.
A very interesting.
Investment.
Next slide please.
Heat optimization saving of fuel costs are mainly based on reduction of the peak load production.
Peak load is very expensive and district energy systems are getting complexer in terms of number of types of sources, biomass, solar, CHPS, waste energy, heat storages, prosumers, etc. And the heat optimization predicts best techno economically production mix, minimizing the production costs and ensuring the quality of supply at the same time which is for every district heating utility. Most important.
This brings savings of 1 to 3% of the total fuel costs, achieve better utilization of thermal energy store storage and reduce the peak load production time and achieves time savings in your production planning. You are having a super good overview and the people who are working with this are having not only good overview but also optimizing their resources.
Next slide please.
Then improve control with Danfoss Inspire Inspire is our new improved control and monitoring system.
Which makes data integration easier and less time consuming, lowers the IT investment and maintenance costs. As this is a web based solution as CADA solution so there is no need for very expensive IT investment for the utility, enables data extractions like heat meter data and interpretation is easier. With trend curves which are available, you can integrate devices with different protocols. It's an open, connected and transparent system where we can not only integrate our own controllers for example, but also controllers from competitors. And it's customized for district energy.
Systems in general, so it's not a general system, it's dedicated to district energy.
Next slide please.
This is the end to end operational management and optimization solution.
The optimization process starts by knowing the behavior of your demand. Next phases is knowing your distribution network which allows us to achieve better primary hydraulic networks balance. This is the network optimization where we have the energies designer for the planning work. This is an offline tool, then the operator Energies Operator which is the online tool where.
We can integrate data from SCADA systems to optimize the temperature and pressure points and most important the temperature optimization part. And then we are coming to the production optimization.
With peak load management as a focus and also production optimization. And last but not least, we can add Inspire for the remote monitoring and control of the whole system. And these systems are as I said before, more and more complex and for that it's important to have software tools which gave a better overview and optimizes the costs and Also.
The operation of the network.
Next slide please.
This is our product portfolio where we have at the basis our components, which I would say.
Are advanced components as a basis where we are trying to make even standard products more connected like this INET solution which I mentioned before. And then the next level going to substations and intelligent controllers and going up then to these software tools like Inspire and at the end optimization and simulation tools like our mentor Planar Energies and Lean Heat solution. This is the way we want to go. And I think it's very important also for the distributing utilities that we are here having a much better overview. Not only selling components and stations, but going in the direction to have knowledge about that the whole systems of district heating, including our software tools to be the competent partner for our customers. At the end.
Next slide please, which is the last one. Then I have to say thanks. Thank you. And.
Please ask questions if you have some. Thank you.
Very good, thanks. Also from my side for the presentation. Good overview, different levels that is addressed. We are quite some over time. So I would see that there's a couple of questions coming. Let's start with some and on in the order as they appeared. And I would like to ask you to try to give a short answer to these questions. First one from agfw Sebastian Grimm.
Does.
Points of worst efficiency.
I know. That's it.
That's what was for the first. Sorry, that was the old question.
That was the first from Kite, whoever that is a fifth day prediction horizon was resolution would be any prediction is very. Is forever. It's a so but then it comes. That was on the very beginning for your predictions I guess this slide. What is the resolution of the prediction you do for your five day prediction?
Yes, we have here.
A tool where we can predict how the weather will develop in the next couple of days. So actually it's for today and for the next five days. So in summary six days. And.
Based on this prediction of the weather you can expect how big the consumption will be and which energy sources you are having available. And based on this data from the weather forecast and on the demand information for the next couple of days we can expect which which of the sources should best be in place. And maybe maybe also you have to consider storage tanks which is also kind of heat source. And it's also dependent on how big is the electricity price. And this is always considered. And then from the system is coming a suggestion which energy source should run when.
So that's.
Easily said what we are doing.
Okay. Okay, I see again short in Time. There's a couple of other questions. Sorry for stopping that at the moment. So we can maybe have that question directly. So I guess your contact details are there. So I would like to ask you the people who had the questions to ask directly via email. So now.
Switch.
Thanks again for the presentation and we're going to switch to the next presentation.
Partner. So representing Schneid and Noda.
I can make the presentation here for my screen or you should return on your screen. Both is fine for me.
Are you with us?
Yes, I see you already. Good afternoon.
Please, please do you the presentation and I will just do the talking.
Okay, can we stop just a second?
Yeah, I just need to switch the.
Just need to switch the screen because it's PDF.
Can you see my screen now?
Yeah, but that sounds on the presentation.
Oh, sorry. Oh, sorry.
In the meantime, welcome everybody and thank you for the invitation. My name is Binta Becky and my presentation is.
Not loading. What's happening?
Also the presentation is PowerPoint.
I have it now here.
This is the right one. Yep, perfect.
Okay.
Yes.
I'm welcoming everybody on behalf of the two companies, Schneid and Noda. Schneid is a small Austrian company based in Graz, the second largest city of Austria and they are doing district heating controllers and visualization for district heating grids. They do that for over 30 years, but they are quite a lot smaller than Samson or Danfoss. So maybe you have not heard of them before, but they are very strong in the business along the Alps when it comes to biomass related grids that have been built in the last 20, 30 years. Next slide please.
The second company that I'm working with is Noda, which is a small Swedish SME with a strong background in artificial intelligence and in analytics and demand side management of district heating. They're also doing that for over 10 years. And my role in relation to those two companies is that I'm consultant in joint projects focus on renewable energies and energy efficiency. I will skip the next points please to the next page.
I want to show you maybe a more hands on view of the problems than the previous presentations that you have seen.
I want to start from the point when you have a white sheet of paper and you are building a new grids, district heating grids today. How would you do it and what would you have? And it's pretty much the same that has been described by the other two companies, what you would like to have and what is possible today. So this page shows you a grid plan where you have single pipes and buildings and you can put in the values that you want, that you're interested in, no matter which one. You can visualize that and have this data shown in your production central in almost.
Real time. Next page, please.
And then you have a visualization of the production. Here you see one of these grids with a few CHPs and with buffers and with the pumps and all these things that are interesting for the people that are actually operating the grids. Next page.
But Schneid has also the possibility to show the secondary side.
Because in these situations they are selling their own controllers, they're linking their own controllers to their visualization system. So they have also access to the data of the secondary side.
And so you can visualize the different heating cycles on the secondary side as well. Next page.
And of course you can. You can see these graphs. You may not agree with the design of it, but I think there's a chance to change the colors, but just to access the data. In this case, it's the data of one of these substations and different parameters that are collected from the substation over the time are shown. Just to give you an idea how such a new system, what you would expect when you, when you build a new system. Next page, please.
So in a very, very simplified way, you would have on the left side the grid visualization. So, so these screens that we have seen right now with the production units that are attached to it. And you would have the blue.
Points representing the single substations, the red dots are the heat meters. So the heat meter is directly connected to the controller. And via the controller you have access to, to the secondary side, which is the symbol to the right of it. And the sun and.
The clouds are representing more or less other data that you may collect directly with a sensor attached to the heating controller in the basement of the building. So that could also be in future the.
The temperature reading from the single radiator.
Frankly speaking, we're happy to have the operative parameters of the secondary side. We have not yet started with doing anything more like Svens Benson has proposed, But I think it's in the future, this is the way to go ahead. So this would be a very homogeneous system if you build it from scratch. But this situation in reality is normally very different. Next page, please.
Normally you have a grid that is much older and you have to do some retrofitting to make it work. In the digitalized world.
That starts with the data communication that very often simply doesn't exist. That's the block in the middle. You have to use one of the communication systems that are available, that could be copper cables, that could be gas fiber. But normally if you're doing a retrofitting on an existing network, you are not doing any digging. You will probably go for mobile phone connection like Samson has explained, or look for a radio or Lora connection that can be done without digging up the streets.
In an ideal world, you have the blue point on the top that looks exactly the same as in a new, completely new system. So you have all the functionalities, you have the controller, you have access to the substation, you have access to the heating circuits in the building and you can attach additional sensors if you want. That would be the ideal world. But very often you will have to use one of these gateways, that's the brown dots below. And they will be linked to either the substation controller or they will be linked to a substation controller over that substation controller, to heating controller and collect the data from the heat meter in this way. So it gets pretty messy if you have an existing infrastructure and this is what I want to show you here. So it's not easy to come from not knowing anything to a world where you can use all these wonderful things that the colleagues before have described. This is probably the biggest challenge that we will see.
Next page please.
And then there is one important thing that you must not forget. If you want to do some influence on the substation, on the behavior of the substation, you will need a two way communication. It means collecting data from some source of sensors and so on. That's the easy part. But if you want to influence what is going on outside there, you will need actuators, as Danfoss called it. Or you will have to have some infrastructure installed that is accepting data. That means you have to send data and signals out and there must be some infrastructure that is reacting on it in some way. And this is very often this is not. People are not aware that this is also part of the digitalization that you have to take care of. Next page please.
So from the projects that we did, the real barriers to a dream solution, the first one is of course investment is required. That means time and money. And if you have a bigger grid, you have to spread it probably over multiple years. There's no way how you can roll out digitalization for 10,000 stations in one year. Not really.
Which leads or has to do. Also with the lack of internal capacity and maybe also lack of skills that are required for it, you are entering completely new field of activities. You have to deal with Telecommunications with electronics with remote metering and all such things. And this may be completely new to your people, or maybe you have a few people who know about it, but the majority of the people, for them it's new. Can you go back once again? Okay, thank you. The other point is legal and contract models may stand in the way. This is an important thing.
All the nice models of rewarding customers for low return temperatures and so on.
Are very clear. But it's always a question if your national law system allows this to happen or if you are trapped in some sort of legal code that makes very big restrictions. So that's an issue to look at. And data protection is an issue, but not really. If you want to do something, you can do everything.
Regarding digitalization in a way that complies with the data protection rules. Next page, please.
So summing it up, it's the challenge is in getting the infrastructure in place. So to plan and install the infrastructure to collect the measurements data in the first place. That means also to take care of the communication side, to establish the communication. And then you have to set up some central database to keep and access this data. And then second, in the return, you have to think of the return channel for control actions in the field and to equip the field with hardware and software that reacts on control actions that you are sending out. Next page, please.
And for me, even more important is the challenge of how to benefit from it. So setting up the infrastructure is spending money. But the second part of the challenge is a strategy to save money, to earn money on the activities that we are doing. Digitalization itself is not a tool. It's like a wrench that lays in your workshop. If you don't do anything with.
Doesn'T do any work. So someone has to use it to apply it.
And biggest problem for us when we start or we want to discuss a project with a client is that the client always asks for optimization. That's fine, but optimization.
Is not more than a buzzword. You have to break it down into real targets. What you want to do, where is your problem? What exactly do you want to do with digitalization? And then you can enter a project before you don't know the answer to this yourself, you should not even think.
Of.
Starting a project. This means the first challenge is not to start digitalization before you don't know how it should work for your company. Maybe it works in a different way in the end. But you have to make sure that you have at least an idea how these things will help you in your in your business.
This also means that you have to think of the timeline of the introduction. You will take some steps, some clever steps. You will start with the biggest rewards and the least risk.
Buildings, for example. You will do it in multiple years.
And to do a rollout, you also have to think.
How you want to measure your benefit. This can be money and how you want to calculate it, but it could also be completely intangible benefits like the numbers of angry calls by people or the number of useless visits by technicians because you didn't know what was going on in the stations. So this is some awareness building that is required inside the company. And finally, make sure that your organization can digest the data. You are getting a heap of data and you will need different workflows to make use of them and to make use of the whole digitalization. If you're just collecting data, this will not help you very much. You have to do something with this data and you may need new tools, new skills. Maybe a.
Different type of employees also will be required.
Next page, please.
So going back to the use cases.
Of course, the most simple and clear and understandable use case is automatic meter reading that can be used for billing and that saves a lot of money. And normally this is also the starting point for many digitalizations because it pays for a big part of the activity anyhow and everybody knows how to calculate it.
The second use case is the remote operation analysis. In the conventional way. This is more or less it was hidden in some of the things that Danfoss and Samson explained. What you can do when you have the data, you can have a look and you can do more clever things.
With the tools that you already have. But you can also have an improved operation by reduced system temperatures. We have seen how that could work by dynamic flow temperatures and control of return temperatures and such things where you do some active control and not just reaction on some, on some settings.
Once you have a lot of data, you will probably want to do some data mining. And if you have a lot of data, artificial intelligence supported analysis.
Will be probably the only way to handle it. This is basically what Danfoss has described what is happening in their more advanced tools, that the data that is coming in is tested for.
Errors and for problems.
And is used for fault detection, for optimization that no human, no person, no operator can do. And then finally, what Noda and Schneid and I are working on as a main focus is demand side load management. That is one of the use cases for digitalization. And also here reduction in peak loads is a big option, but it's not the only one. It's also an effect on the spare capacity that you have. For example, if you have a geothermal supply and you don't use it, when it is there, it's gone. So you have to peak in the morning and unfortunately you had free capacity two hours before, but you couldn't use it. This is one thing for demand side and load management.
You can reduce the peak reserve that you have because you are better in planning and managing. You can ease bottlenecks in the distribution. So maybe pressure problems or flow problems or total distribution problems for a part of the grid.
All these are use cases that require some sort of digitalization.
And.
You can do what you are doing now without digitalization, but with more data, with more precise data, with more. More data about what is happening in the field. Of course you can do a lot more camera things.
Next page, please.
And then finally to come back to the origin of the discussion. What does it mean? There is an interdependency between digitalization and renewables. It also was said already.
We have today the situation is that the supply must follow the current demand, but the renewables have their own pattern when they are available. So you have a permanent conflict of these two things. And you can use the digitalization to make better demand predictions. That was said before. I completely agree on that. You can have the physical storage of heat from renewables, for example, to decouple demand and supply. That also helps. And you have this demand side management, we call it sometimes virtual storage, that also can couple the demand to supply and link it together so that the demand occurs more in the times when the supply is easy or is available.
Next page, please.
No, this one, yes.
And here is one practical example. That's a grid in Austria, a small biomass fired grid with about 18 gigawatt hours of of heat sales per year. And you have different groups of buildings that we, that we selected. The highest curve is the not managed stations. That's about 50% of the of the grid. The stations just do what they do. And the others have been.
Put into different groups for several reasons.
And this shows how the profile is distributed across the day in hours. And you see that you have the morning peak and the evening peak in the not managed stations. And you see how much we can achieve and how much we can flatten the demand curves in the other groups. You have still a morning peak, a little morning peak, but it's by far not as extreme and it helps to reduce the whole.
Morning peak quite significantly. There are some points that are marked here that show that in the groups that are managed we have also forced water, hot water loading in the morning. You can see this is maybe 10% or 15% of the load in at 3 in the morning. That is added to the natural demand that would be there without doing it. So it's not a lot, but in the sum it helps and it is a good thing to have this 50 or 100 kilowatt in demand from this three in the morning and not at six in the morning.
Well, that is what I wanted to show you. And the next page please.
Okay.
If you're interested in learning more about the companies please contact one of the contacts here or have a look at the website or contact me directly as you like. And I'm looking forward to questions. Thank you very much.
Yes, thank you a lot for your presentations. There have been a bit discussion in the background in the chat.
I am a bit afraid that we are running heavily over time now 20 past so there's still 10 minutes left for the question sessions. So I.
Unfortunately I have to skip the questions now. I'm sorry for the bad time management but you have all the contact details here in the slides and we will send out the presentations as well in the next week as I said. So we have all the time to discuss directly with.
With the presenters. What I wanted to do now as I said is going to the interactive session. Just a second.
What is happening here?
Going to the interactive question and answer session and I guess we're going to go a little bit over time if that is okay for everybody.
So now you should be able to see my screen again.
So we are using now we're going to do now online survey basically let's see what we can make and manage.
Separated into three different questions. As I mentioned at the beginning we would like to collect the most important challenges regarding the technical operation communication systems. Very much what we just discussed but above that also what is the market operation of ICT tools or are they implemented? What is general boundary conditions for doing so? And at the end the business operation, customer involvement, acceptance and the way we do that is use online tool that's called slido. This is. You can either go to your with your mobile phone and and scan this QR code or you go via slido.com and then the the website will ask you to give in a code that is 37400 what you can see here. And then you will be able very soon to answer a couple of questions all these questions. So there Will be three questions we're going to address here in three different slido questionnaires and.
Just gonna start. I'm gonna just change.
Just a second.
Just gonna.
Just a second.
So you should see now.
The slido screen I hope and we will start with the.
First pole whopper.
That'S the second one. That's the first one. We will start with first.
Question now on the most important challenges regards to the technical operation and communication digitalization solutions industry heating and cooling.
So if you are already online just type in. You can use multiple type in multiple.
Answers so you just type in your answer. Don't make it too complex just try to make simple answers because we hope we hope can see a word cloud coming up here just anything what you come comes into your mind.
Okay Range of substations components.
This is not clear enough. Okay I will give you maybe an examples what is meant I just need to switch again to my presentation.
So from a technical point of view technical communication points of view this is about the challenges regards to the ICT behind the automation and technical controls of the grid generation capacities, consumption and storage devices but also when it comes to to the communication issues on apps e.g. web based tools to inform integrate consumers the future energy system.
The complexity of the system the different timescales we have to consider the different data resolutions we get. If you want to model if you want to generate digital twins connected to the data availability so these are examples of challenges.
So if you maybe have more.
We can then see them in the.
I don't know.
If there are any more answers here. Oh yeah, I hope you can see no, you cannot see. Just need to stop sharing again and start sharing again.
Oh yeah, there's a lot of answers already coming. I see a lot of on old data and protocols.
Consumer interest communication.
Substation controls. So data data seems to be data and protocols seems to be a big topic. Things are still coming in 16 Responses we have at the moment.
Standards are popping up now big so data stand there's some. I don't know what is meant with staff. Maybe someone can clarify in the chat window what is meant with staff. So Steph, is the. Is. Do you mean the people that are working on the digitalization solution.
Is that something Because DAF is now quite.
Quite a big point here.
Lack of skills someone answering okay, so that's the lack of skills that is in your company or in the company of the energy utility or engineering offices that are able to integrate these standardized solutions.
Okay, that works very well. 32 replies already.
Yeah.
So another Similar answer. Staff members of the utility companies lack of skills. Okay, very good.
Standardization standards we have. So the standards are one of the biggest challenge I see. And availability of data or old data complexity in the data staff and skills I guess is quite similar. And data protocols.
Okay, very good.
Perfect.
I don't see any more answers coming in so I hope this is gonna be saved. So I'm gonna go. I'm gonna stop that poll now and I gonna go to the next one. The second one.
The second one is on market operation with digital solutions with industry heating and cooling. So market is all that is the boundary conditions. That is the.
Overarching ICT platforms that are boundary conditions when it comes to data protection. Legal issues. Exactly.
The business is a bit. The stakeholders and business models is in the next questions. Fragmented ownership. That's very good. Legal issues.
Competing interest is also a bit more to the second questions. The general value on the ICT platforms that is maybe overarching. That is not very technical. But the ICT means Data security is a big point. Okay, yeah, that's a good one. Mentioned several times. Obviously.
Fragmented ownership. We had that already. Or that is coming. Data security obviously a big point.
Okay.
So 18 answers. Let's wait for a couple of more in points. And compatibility I see there at the very back at the very bottom part. It's a bit more on the top technical side. But I see. I see that's also influencing to the data security and illegal issues. Things also compatibility I see for my side as well on the framework how they fit together.
GDPR now popping up. I've mentioned several times.
Supply values.
I don't know what meant is with supply in this. Maybe someone can clarify what's meant with supply and bsi. I don't know that aberration. Maybe someone can clarify in the chat what is meant with BSI and data supply or supply in general.
Incentives. Okay, incentives is now popping up. That is a new point. So incentives for digitalization I guess what is. How can digitalization measures be financed on a larger scale? Maybe I would like to add in this way. How can this be enforced? Also with other.
With other measures like the regulations. There is a clarification in the meantime on.
Supply. Contractual supply temperatures. Okay. That unfortunately that word cloud is. If you. If you put a whole sentence it is taking the single points out. It doesn't. Doesn't look at the whole sentence.
But contractual issues to your customers. It's a point. And how to enforce these contracts as well. There's still answers incoming, but I think it's now A stable result.
Very good.
Very good. Perfect. And then let's use the last. We are a little bit over now, but I think we are. That's fine. We started already a bit later. So let's go to the next one.
When it comes to business operation digitalization solutions so challenges when it comes to stakeholder involvement challenges when it comes to business models added value of digital solutions.
Things like visualization.
Customer acceptance as well are the questions that are put in here.
Fixed tariff time and money.
Time and money. I guess that is meant with how to install these things and that if people are interested or not to spend time and money on digitalization solutions.
Okay, answers are incoming nothing dominant at the moment. Ownership is a big point. Obviously has been addressed in the other one as well. Existing contracts that are difficult to change I would assume is meant with.
User acceptance.
This more broad here Ownership now is coming the second time so it makes it larger. I guess that's the nature of these word clouds.
Big challenges when it comes to business models.
So all answers are still incoming. User acceptance benefit I guess benefit both to the user and to the.
Utility I would guess is that sometimes one of the big challenges for digitalization solutions here.
Value sharing is part of the benefit and user acceptance point.
Needed.
Needed is now I guess that's part of some other sentence that just comes pops up twice or something like that.
Property management is part of user as a part of owner ownership at the end the capex discussion benefit and benefits is now twice. So yeah, the benefits of digital solution user acceptance ownership.
Digitalization strategy Obviously what is the best way to address consumers and install digital solutions.
That are obviously big points here.
Okay. I think we are more or less stable now with the answers. 21 answers. That is more or less the value we had at the other questions as well.
Very good.
Okay, perfect.
That's very good. I'm very happy on these answers. Perfect. I want to stop the poll now. Obviously this is not a complete set of questions.
This was just basically just a very. Just a very brief look on these points. We will put them together as I said the next steps. In summary, we are now at the end of this webinar. Again was quite happy on the technical conditions. We always made the timing. We would obviously be nice to have a better interaction. But again with hundred now still above 70 people attending. It is very difficult to consider all people and to have everybody give a voice to everyone. But at least a lot of participants were at these interactive poll. We will take down the notes. Obviously you're happy to you're free to send us more input regarding challenges. And that now brings me to my last slide summary. As I said at the beginning, we will make the recording of the webinar, both Blocks 1 and 2 available together with the presentation slides that will be very big files, especially the recording. So we will have it somewhere where you can look at watch it online. The two big points we discussed today if you want to join the IADHC Annex TS4 so the working group that works on all this digital solution, that is Dietrich Schmidt is your operating agent. So please contact him directly to discuss your participation in terms of context when it comes to funding, how you can fund your participation. That is you can you then need to contact your national IEA DHC representatives that are listed on the website. You can see here with regards to members and alternate members. Actually for the Austrian ones, Michael Huebner who was presenting in the morning and me are the Austrian national representatives of AIA adhd. But you will find the other ones on the website as well. Some countries are not participating, so that is a bit more difficult to have them integrated in the annex. And finally, if you want to, if you're interested in money, if you want to get funding for big new exciting projects that act with customer acceptance, with data standards, interoperability and so on and so on, you can check the website eranet Smart Energy Systems the call is not yet open. It will open as Michael expressed in September. But now is the time to put your to us to code your national funding agency. The funding conditions for Eranet are very different to Horizon 2020. It is a European project, but you have to go to a national funding agency. You get everybody gets national money. So Austrian Austrian stakeholders get Austrian money. Sweden stakeholders get Sweden money. Danish stakeholders get Danish money. So you need to very much talk to your national funding agency. Look at your national funding condition and some countries might be participate and some might not. So if your if your country is not listed, if your funding agency is not listed in the list of funding agencies, you urgently need to talk to them that they can participate in the Internet call.
Or some of them, even if they are on the website, they doesn't mean that they necessarily participate in each call. So certain country might not participate in this specific digitalization call. So please talk to your national funding agency that you are interested in putting in the proposal and that they should participate in the eranet and in the specific call for digitalization solutions. And obviously we are very happy from the Annex TS4 also to support in building up consortia.
There's A lot of people have been in the webinar that are interested in in this point and yes, that's all from my point of view. I don't know. Dietrich, as a co organizer, do you have other points at the very end.
Or.
From my side? A big thank you to all the participants. At least to the participants who are left here in this conference. Yeah, thank you very much for giving me the opportunity to present TS4 and for all this very interesting input from all the presenters.
Thank you.
And of course thank you to the colleagues from AAT for organizing this one.
Yes, thanks a lot for all the participants for the questions, for your involvement and for your patience with listening to a lot of discussions, a lot of talks in the webinar. I hope it was good for you. Looking forward to see some more of you in the TS4 meetings. And maybe we have a future webinars on similar issues with more presentations with other topics. I think I like the format. It was a bit skeptical if it's really working, but I think it works very well.
I can integrate increase interactive sessions and decrease the presentation times a bit in the future, but we will see that. So yeah, was nice meeting you. Was nice seeing you. Oh, let's maybe let's try at the end. It's the same with webcams. I forgot about totally about that. So if you can switch maybe on your webcam, those who are still online, those who are still here, but still enough to fill two screens of webcams.
Then we can make a. We can make a group photo again. So everybody who is interested or who is still online, the first 25 that will come through will be on the screenshot. At the moment it's the only disc with me. So everybody's leaving already. Maybe I was too late with announcing.
Hello, Ralph Wohrman, this is Michael. I just wanted to say thank you very much for this interesting webinar, also for describing correctly at the end again the mechanism of our joint programming platform. And for your last question, the camera is still not enabled.
You know, I now I understand that I will just need to see how that is possible. Oh, damn it. Just one.
So, okay, if you don't. If you're not able to manage to make the webcam, turn it on for everybody. How was it? Just a second.
Huh? There was an option to hide it for everybody and now I don't find it anymore. How to unhide it.
At least we have the photo from the first session. Yeah, someone did it. Perfect. Now we have the camps going on. Wonderful.
Now it's coming.
Perfect. So let's see who is joining. Robin. Oh, wonderful. Good to see that you are online. A lot of people here already. Wonderful.
Sven, still online.
Good. So I will make a first screenshot already. We have still some attendance inside on the web. Just a second.
So I make a Screenshot now in Swedes 2:1. And now this is a screenshot and a second one as well. Perfect. So that's not exactly what I was aiming to since a lot of people already left after my final words, but we have some and it's a good proof that people are online. It's good to see people not only talk to the darkness or to the screen so much. So then again, thank you. Goodbye. Stay safe. I hope you be.
Hope we all manage the situation very well. And I have to tell my son not to be so loud when I'm in a webcam. Perfect. So thanks a lot for participating.
Hope to see you in the future and cooperate. Maybe have a chance to even cooperate.
With some of you in these topics.
Bye. Bye.
Thank you.
Bye.
Thank you.
Thank you for.
Thank you. Bye.
More from IEA
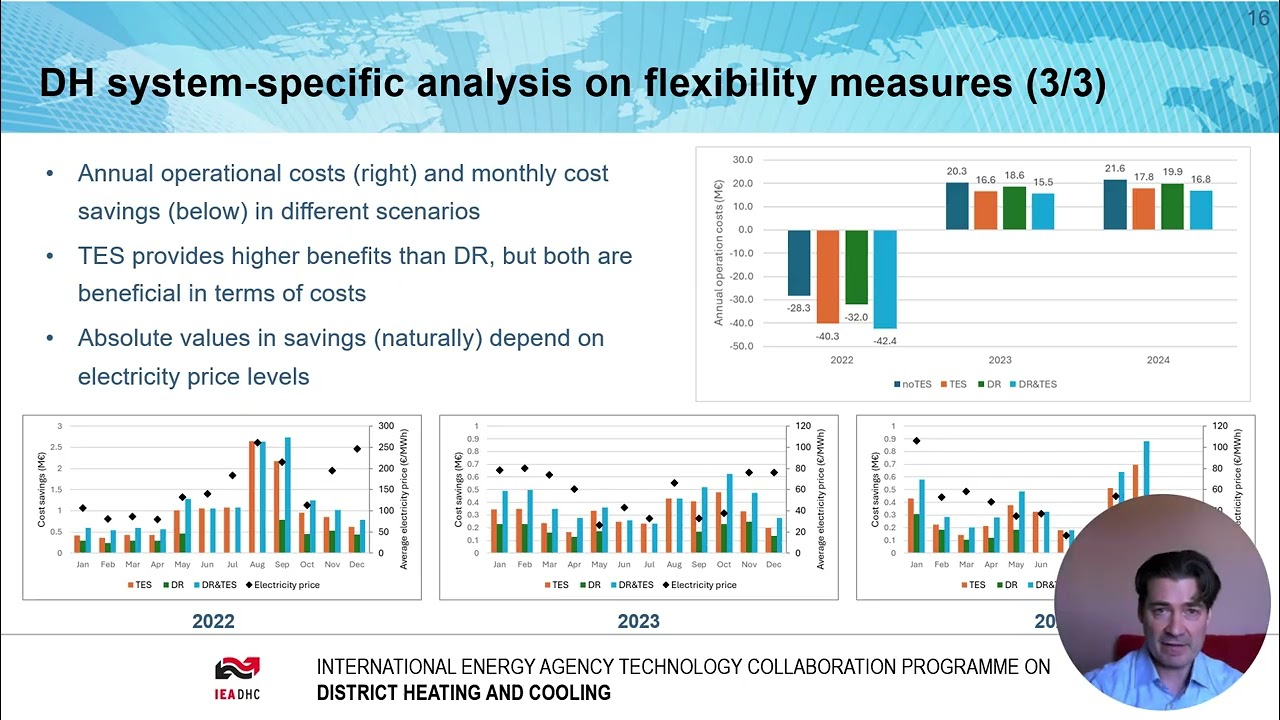
XIV-05: Flexibility and DH value chain (FlexVal) – advanced analysis & compatible pricing
XIV-04: RE-PEAK - How to cover peak loads in district heating networks with renewables.
Digitalisation of District Heating: Summary of findings from IEA DHC Annex TS4
25/01/2024: The crucial role of district heating pipe lifespan in achieving climate objectives
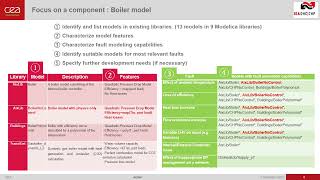
IEA DHC XIII-03 Generation of simulated faulty datasets to ease heating network fault detection
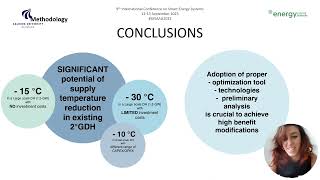
XIII-01: Leave 2nd generation behind: Cost-effective solutions for small to large scale DH networks
XIII-04: Cost Benefit study on the building secondary network for improving DH performance
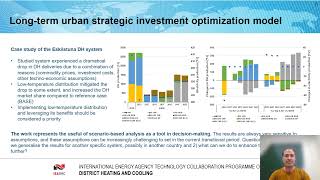
XIII-05: OPTiTRANS - Optimized transition towards low-temperature and low-carbon DH systems