XIII-07: CASCADE - toolbox for integrating low-temperature sub-networks in existing DH networks
Researchers present findings on integrating low-temperature sub-networks into existing district heating systems. Technical feasibility depends on mass flow, connection point, and temperature levels. Economic benefits are higher with non-combustion heat sources, though tariffs and regulatory barriers remain significant obstacles.
Chapters
Hello dear participant participants, I'm very glad to share this session. And finally my perfect, my just most interesting for me topic District heating. Yes, and we will have a session related to district heating meeting topic. And for me the main challenge in the beginning to choose the right language, Latvian, Estonian or English. Because actually I'm glad that I am now in my alma mater in Riga Technical University. So my name is Anna Volkova and I have defended my PhD here in Riga Technical University. But I worked during 13 years already in Tallinn University of Technology. I am senior researcher and head of research group focusing on district heating research. And I would like to thank organizers of Connect because actually two years ago.
We submitted our project proposal International Energy Agency District Heating and Cooling about cascade solutions. And two years ago Connect organizers.
Offered us their help that we will be able to present results of this project during this conference. And now it is going on and actually first part of this session will be related to cascade to cascade projects and three presentations will be related. So Kare to Lepexar from our university from Tallinn University of Technology. Then Hanne Kauko will join us online from Norway from Sintef Energy Research and Stefan Reuter who is here from Austria Institute of Technology will present his presentation related with Energy Cascade project. Then we have small changes and one presentation will not be. And later Lina Murawskayte from the Human Energy Institute and Vivit from Riga Technical University will continue with heat supply related topics. But I will call every every presentation before it. So our first presenter is junior researcher and PhD student from Talent, Kerto Lepexar. And.
She will present as first part of Energy Cascade project related results about barriers and drivers floor reviews.
Thank you. So I am going to talk about energy cascades, barriers and drivers. And I am Gertol Epiccsar from Tallinn University of Technology. So I will start presentation now. Firstly I will start with what is energy cascade in a nutshell. So energy cascade is a district heating system where smaller sub networks with lower temperature levels get the supply from the main higher temperature level network return flow as you can see from this scheme here.
So this study is dedicated to determination of the drivers and barriers of implementation of energy cascades. Necessary information for this study was collected from previous studies, country legislation and tariffs and from other results of other work packages of this project. The main stakeholders in this case are energy companies. In addition, for necessary data collection, different experts, researchers and engineers were also involved. Other stakeholders who were involved in the study were consumers, real estate developers and authorities. For data collection, questionnaires for stakeholders were performed and workshops, meetings and interviews were conducted.
The main purpose of the survey was to rank the barriers, thereby identifying the most significant of them. The respondents have the opportunity to provide their own answers to all questions and it is assumed that.
The insights obtained will give additional value to the survey. The first section refers to the respondents field. If the respondent is a representative of a dislocating company therein additional subsection of the characteristics of the superior distributed network. These characteristics were used to determine potential benefits such as annual heat production, characteristics of the heat generation units, pipe length as well as supply and return temperatures. This section was used for a more detailed analysis of the responses provided by distributing professionals. The second and the third sections include lists of non technical and technical barriers respectively. The fourth section includes the list of drivers.
Initially it was decided to contact experts and companies from the International Energy Agency, district heating and cooling member countries. In addition, we contacted respondents from the.
Baltic states in the study.
Very large number of contexts were used. The contacts from International Energy Agency, District heating and cooling member contacts, the national district heating associations like direct contacts and member databases lists of regulated district heating companies from politic states sharing.
We also shared the survey with members of Euro Heat and power contacts and our personal partner lists from Estonia, Latvia, Austria and Norway and from our other networks from LinkedIn workshops and conference presentations. As a result, approximately 1,000 experts and companies were contacted.
As a result, we gave yes, sorry.
Cannot hear anything.
Okay.
As a result, 112 answers were received. 35% of the answers came from academia, 20% of the answers from engineering companies and 45% of the the answers were collected from district heating companies.
This slide displays the responses of the service concerning technical barriers. As you can see, the most important technical barriers were the necessity of locally boosting supply temperature, more complex regulation, limited mass flow and lack of suitable locations for the installation of facade below temperature district heating network.
This slide here displays responses about non technical barriers. The most significant of one is that the tariffs do not take into account temperatures which was pointed out most often based on the interviews with the representatives of district heating companies. One of the related barriers may be the complicated procedure for changing and approving tariffs and in some cases it is much easier for the operator to connect the sub network directly to the superior high district heating network. Almost same important non technical barrier is high investment costs. The cost of the heat exchanger will be higher for the sub low temperature district heating network option since the area of the heat exchanger depends on heat energy, heat transfer coefficient and logarithmic Mean temperature difference.
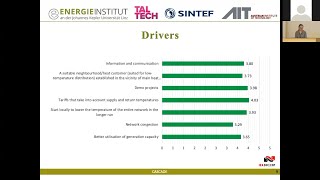
The results concerning the drivers are shown in this slide. Drivers are mostly related to the barriers described by which were described earlier. The tariffs based on network temperatures and demo project were named as the main drivers. In addition, information and.
Communication were mentioned as important drivers. The authors of this report hope that the current study can help provide more knowledge and information on the subject of subload low temperature district heating network. Tribals that will lead to an overall increase in the energy efficiency of the system were mentioned as very important. These main drivers are the better utilization of generating capacity and transition to a low temperature distribution network.
As I mentioned before, there was a special subjection for district heating companies in the service that were taken up. So there were questions regarding the availability of potential locations and areas, new urban area developments or areas where a significant part of the building stock will be subject to renovation in the near future.
These are the areas that suit well. The results with answers to these questions can be seen on this slide. As you can see, a fairly large number of potential locations are available that can be connected to the network.
So based on the analysis on the analysis responses the feasibility conditions for successful implementation of the cascade solutions are shown here. The conditions that need to be are High temperature network flow must be high enough supply flow high temperature network should have enough capacity. The pipe should be at least 20 kilometers long and the diameter should be more than 500 millimeters. The low temperature sub network should be located near the transmission line and rather close also to the heat generation unit in order for heat generation efficiency increase because of return by production temperature reduction the heat the generation unit should be combined heat and power plant large heat pump or heat generation unit with flue gas condenser.
Also the tariff system should take the temperature level into account so customers with low temperature level heating system should have lower price for heat. The design process should be standardized standardized and the design process and ownership issues should be.
In order to increase feasibility Investments could be covered partly by municipality or by government.
So I also would like to give the acknowledgment. So these results that are presented here are preliminary and were made possible thanks to funding from International Energy Agency District heating and Cooling the program on yeah, the results are based on the project Cascade A comprehensive toolbox for integrating low temperature sub district heating networks in existing district heating networks and this was financed by International Energy Agency Heating and cooling within Annex 13. Thank you.
Thank you.
And this is also a scheme regulations.
Do you have any questions in audience?
Yes, thank you. Eva, please can you please give microphone?
We have here process of microphone transition.
Thank you very much for the nice presentation. I wanted to ask how you evaluate how informed the experts who participated in this survey was. Do they know what is the cascading principle? Or there were any information campaign before or.
Something.
Maybe due to the fact that we realized this project and this first.
These contacts with experts were realized by us. So we provided in the beginning we provided short definition with explanation what does it mean?
And actually these contacting experts was in addition like informing like workshop and especially with district heating companies. We had some meetings and discussed and this was an additional information. But as a result of this project, I think till the end of May or in the beginning of June a detailed report will be published publicly available. And partly this research has been published already in Smart Energy journal so Ruby. But yes, it is rather niche solution and that is why not all experts were informed about it.
Thank you. Thank you, Anna.
Okay, are there any questions? Because I would not ask.
Okay, thank you very much.
And as I understand.
Next presenter will be. No, still Hanna. Yes, because we have changed all the time. So next presenter will be online.
Hanne Kauko.
Yes, can you hear me?
You are here already?
Great.
She just came from the ship and promised us to join us. Very good.
Actually I'm still on a ship.
Yeah, but it's Hanne Kauko from Norway from center of Energy Research will tell us about simulation case studies on cascade that again low temperature sub networks in district heating.
Please.
Hannah, floor is yours. We see you but don't see still your presentation.
I actually see you as well. So first thanks for giving the opportunity to join and I'm sorry for not being there physically. I'm glad that we have this amazing technology which makes me able to even see you and watch what's happening in the audience to some degree.
Anyway. So my presentation is from this same project that Shasti was talking about which is cascade. And this goes as Anna just said to more on simulation case studies. So more on the technical side and focusing on single sub networks in district.
So the object here was to evaluate the technical barriers for utilizing heat from the regional line from the perspective of a single low temperature distribution network using data from selected case study areas.
And my presentation I will first look at the model. So we our method was dymolar dynamic modeling. With modeling and dymolar.
Then I will present the case study areas we have been looking at then going to results and finally the conclusions.
So as became clear from the previous presentation, there are not so many actual realizations or.
Realizations of CASCADING sub networks. But one of them, one of the countries who has done so is Denmark. And then the supplier Danfoss who has actually implemented such a solution. And this is the PID diagram from the layout at comstrip that Danvers has done. And with the lack of better knowledge, this is kind of the layout that we use as a starting point for our model. So in principle, I mean it's not that complex. You use the flow from the return line as much as possible.
And then when it's not enough you, you take heat from the supply line. But when we started thinking about it a bit more in detail, it we didn't realize really it wasn't so straightforward that how do you actually control. When do you. How do you decide when do you need to take heat from the supply line? And not least how much do you need?
And when we asked, Danfoss said, okay, how do you actually control this? What do these boxes mean? They said yeah, there was this expert who did it with we don't know how we did it and then we didn't hear more from them.
But so how we. This is a very simplistic presentation of representation of how we chose to do it. So here's the return line from the main for the main discrete network and here's the supply line and here's a pump taking heat from the return line and this flow is then controlled based on the set point on the secondary side. So in the sub network which is the normal way of controlling heat in this kind of situation. But in this case when we have the mix in, if this temperature here is not sufficient, we need to mix in heat from the supply line. And the way this is controlled is we have a set point temperature here before the cascading heat exchanger on the primary side and we have set this set point temperature to be equal to this temperature plus 5 Kelvin or whatever offset you want to use. So this is the controller we used basically.
And in the subnetwork in this case we used a.
Fixed return and supply temperature and the demand which is based on data that we obtained.
And just if you have any questions just feel free to raise your hands.
Yes, the case studies. So we had looked at two different neighborhoods. First one was in Norway, quite large one or planned large one with a total heating demand about 12 gigawatt hours per year and a maximum demand of four and a half megawatts. And this shows it's cold place. So the heating demand is quite high. The red is heating demand is quite high in the winter when the temperature drops down to minus 20 and in summer it's quite low.
On the right we see the supply and return temperature in the nearby network branch. And here we see that this is very.
What I say, very messy and not very clean. And this is because in this particle network they need to maintain quite high.
Supply temperature also in the summertime due to requirements on certain customers. And this results also that the return temperature is high also in the summer, which is very much reflected in the results as we will see soon.
For the Austrian case. Also here heat demand correlated with outdoor temperature, although temperatures do not get that low in the winter. And here they are a bit higher and a very clean profile for the supply temperature and for the return temperature. We didn't have the data, we just assumed a constant value of 57.5. This was a small area with a total heating demand of 5.7 gigawatt hours. So about approximately half or less than half of the demand of the area in Norway I was looking at and a maximum demand of 1.7 megawatts. And the previous one it was four and a half. So it's much smaller network.
Or smaller sub network.
And what we wanted to look at was first the total annual supplied heat from the supply and return line as well as the maximum heat demands from the supply and return line. And how then. And the third point was how does the sub network impact on the return line temperature? And we looked at three different supply temperatures in the sub network. 50, 60 and 70 degrees while the return temperature was kept constant at 30 degrees in this sub low temperature network.
So the first graphs may look a bit diffused, especially for this case. So what this shows is the heat supply from the supply line on the left side and the return line from on the right side as a function of the demand for the different supply temperature levels. So blue is 70 supply and 65, 50. So we can see, although here the correlation is not so clear. But when we have a 70 degrees supply temperature, the rate of increase in the supply from the supply line increases more when the demand increases than when if you have a lower supply temperature in the return line and the opposite is true for the return line. So the higher the supply temperature requirement in the subnetwork.
The less is the rate of increase. The lowest rate of increase in the heat demand in the heat supply from the return line as a function of the demand.
And this graph shows the first, the total heat supply from the supply line is blue and return line, they're orange as well as the maximum heat supply from the supply and return line. And as in this case for the Norwegian case there was very little.
The return temperature was so high throughout the year and also showed quite little correlation with the demand in the sub network. And thus also actually the maximum demand from the regional line is quite constant. And in the maximum demand from the supply line there's only a moderate increase.
Although the total in the total heat there's kind of clear increases. Obviously the higher is the higher the temperature in a subnetwork the more heat you will need from the supply line obviously.
And this shows the temperature reduction in the main network line. So.
In this case the network branch where the sub networks run had quite well, fairly low mass flow approximately 60-80 kg per second during high demand periods as well and 2030 during low demand periods.
And the mass flow in the subnetwork is actually not that far from it about 4 to 55 during high demand periods and 10 to 20 during low demand periods in the case with supply temperature of 50 degrees. And as a result of this we see that.
The return line temperature in the main D3 network branch where this connected is quite a lot affected. So there's quite a large temperature reduction in the return line up to 20, even 30, 40 degrees demand periods.
Now the Osfran case was very different because there we had assumed a constant constant return line temperature at 57 and a half throughout the year and and the supply line temperature was very strongly correlated with the demand so being very high when the demand is high and lower when the demand is low.
And here we see that.
If we have a, if the sub network has a sub supply temperature requirement of 50 degrees which is higher and no sorry, lower than the return line temperature, then we are able to cover the entire heat demand of the network from the return line obviously.
And then when we increase.
The supply temperature demand in subnetwork the requested temperature flows from the supply line increases.
And also here since the return light temperature was constant, we see a clear reduction in the peak heating demand from the return line and conversely very clear increase in the peak heating demand from the from the supply line when the supply temperature requirement from the sub network increases.
This shows again the graph for the heat supply from the supply line as a function of the demand as well as from the region line as a function of demand. And here since the temperature profile was so much more, I would say clean for the Austrian case we see a very clear correlation here that the.
At the highest supply temperature requirement at the subnetwork it's quite clear rate in increase from the heat supply from the supply line. And no when we have of course no heat when the subnetwork temperature requirement is below the return temperature in the return line. And conversely we see very clearly that.
In the return line the rate of increases from the. Of the heat supply from the return line is very clearly correlated with the.
Heat demand and is highest for the lowest, lowest temperature grades when we're covering all the demand from the from the return line.
And in this case the mass flow in this. In this network branch was very high, 15 kg per second to 3, 400 during low demand periods. And while the mass flow in the sub network was very low. So then the effect or the reduction in the main network return line was very minimal.
With this coming the conclusion. So my. The conclusion from the case studies are very much the same as what's her name, right.
Was just saying in the previous study where they were looking at the more based on the survey.
So obviously yeah, the benefits are the better when the lower this is the supply temperature in sub network. So for instance the Austrian case, when the supplier temperature requirement in the subnetwork was below the return temperature the entire year, we were able to cover the demand entirely from the return line.
For the network. And when the sub network supply temperature requirement increases, the more we need heat from supply line.
And again.
The mass flow in the nearby network branch should be high enough.
Such that the impact on the return line temperature is so high.
And finally we saw that the heat demand from the supply line is less dependent on demand if the supply damper in the main network or the nearby network branch has a clear correlation with the heat demand in the sub network.
Thank you for attention. I didn't have an acknowledgment slide here, but I will acknowledge the same financing partners as shares. Thank you.
Thank you.
Yes, I see. Question from Dagnia Blumberga.
It was very interesting, but my main question is about waste heat. You showed a nice scheme, but could you explain, as you know that the European Directive is telling us that we have to involve more and more waste heat from industrial plants from other heat sources. And this waste heat is with very low temperature sometimes. Where is the place in your scheme, cascade scheme for waste heat?
Yeah, that's a good question. I'm a very strong supporter of use of waste heat myself and I've been so in this particle case study we looked at specifically the possibility of using return line, but there is no. It could well be a good idea having a subnetwork where you say primarily use a local waste heat source and then maybe support the demand which cannot be covered with the waste heat source from the return line. So this was not specifically looked at in my study as it's focused on kind of the possibilities of looking at the return line temperature. But it could well be integrated in such a system.
Then I have next question about in greenhouse gather emission reduction. Have you calculated what this cascade principle is bringing for climate change policy for climate targets?
I have not, but Stefan, who will give the next presentation has done it.
Maybe I just can comment yes on it. Actually we had before some papers for other cases where we calculated and CO2 emissions too. So actually here we try to provide to consumer this as low temperature as possible. And unfortunately we have, you know, you have in Riga and Italian we have another cities, we have new good districts which are absolutely ready to connect to low temperature district heating. And we have high temperature district heating networks as Riga, Siltum Sotilitas and so on. And what are they doing? They just connect high temperature to building that are ready to take it. And maybe I would ask Hanna about your opinion because we had many discussions. But what do you think this type of solution would it be long term or some short term operative solution for district heating development.
Scale solution?
I think still that it's more of a niche solution, that in some cases it can work, but it will not be a mainstream. Whereas I think like wasted, as was asked about previous. I think this is something a lot of district supports. The local diesel supplier in the city where I come from, they are saying that further on that all the kind of expanding in expansion in demand should come from wasted sources. And they are actually working to reduce the supply line temperature in the main network which will also.
Contribute to retirement temperature, which will then again make benefits of solutions like costing less all reduce the benefits. High temperature networks where there's no future plans on working to reduce.
It can be a good solution, but I think probably not like a widespread mainstream solution.
I would think because it will speak.
About these benefits what can be operatively get in rather cheap way way. So it will be first of all return return line temperature reduction in whole network which will give heat loss reduction and which will increase efficiency of. I don't know, flow gas condensers or CHPs. But it is rather small. But it will give. If we give what what we calculated from for one Tallinn case it was 0.24 degree of temperature reduction return temperature reduction in whole network. But it gave rather good effect and payback period would be two, three years. But our company Decided it would be too complicated to recalculate something to recalculate tariff and so on. So this administrative barriers. So it can be for sure we understand that it would not be some very long term or sustainable solution for the future because we hope that temperatures in district heating would be reduced.
And in this case it would not work. But from the other case till this moment, we would have this low temperature district heating network Icelands and it would be prepared and we will live in low temperature district heating world. Are there any comments or questions? Maybe I talk too much today. If no. So thank you Hannah. See you in person somewhere. Thank you.
I hope to see you next. Bye Bye.
What should I do something? No. Our next presenter is Stefan Reuter from Austrian Institute of Technologies from Austria, who came to us. Thank you Stefan. And he will tell us again about this cascading solution but this time more about techno economic scalability and operational dynamics analysis. So please follow yours.
Thank you, Anna. So, hi everyone. As was mentioned, my name is Stefan Reute, I'm from the Austrian Institute of Technology and I will tell you for the first time something about cascading. So by now everyone should be an expert anyways. But let's see if we can still see something new. So the background of the project as was mentioned already, it's part of an international research project Cascade that was funded by the EIA DHC program. And the main background or like our goals we were like in general district heating systems they can be an integral part of a sustainable heating system or sector as they can offer fuel flexible and efficient supply of heat demand. However, the current networks they are strongly relating on high temperature sources excess heat from waste incineration or CHPS and therefore they operate at high temperatures of 180 to 120 degrees supply and like 40 to 60 return temperatures. And in order to be fully integrated in a smart energy system, these temperatures would need to decrease. Therefore, as we heard, there are multiple benefits and also that would allow the integration of other sectors, the coupling with the electricity sector, for example also the gas network. So what we are looking into was like okay, there is an existing challenge on how to transform this economy existing high temperature networks into low temperature networks. And we were looking at if weather cascading of low temperature networks in an existing high temperature network might be an option for transforming the overall network to a low temperature one. And how we what my part of this, of this work was like, as was said before, like a techno economic scalability analysis. And also we looked into the operational Dynamics of such energy cascade.
So what is cascading? I mean you've seen this slide before, not talk very much about it. Just one comment on this. We were looking into a heat exchanger here, connecting the sub network to the return flow of the existing network. As I said before already, when the return flow is not sufficient to provide the demanded heat in the sub network, then mixing from supply line would be needed. And yeah, so what the main parameter that we are looking into in our techno economical assessment is actually the achievable return temperature reduction after the cascade. So before that probably in this illustration you would have 50 to 70 degrees and then after the cascaded sub network this temperature level would be lower. And we were assessing the economic benefits of this reduced return temperature in the main network.
Okay, so now to the method that we applied. The technical analysis was based on a classic static simulation. So there were consecutive steady states based on some limitations in the calculation method. So for example for this static analysis we didn't consider the heat losses, we didn't consider different temperature levels. So we kept it quite simple as a high, high level analysis. We also only looked at the simplified network topology. So meaning that we have one central heat exchanger and linear network topology, we were looking into different assessment scenarios. So meaning that we looked at the impact of changing the connection point of the sub network by changing the available mass flow. We were looking at the effects of different high temperature return high temperature network return temperatures and also the impact of different sub temperature sub network temperature levels. And additionally we also looked into what is the impact of connecting multiple sub networks into one high temperature network. Yeah, as I said before, the assessment was mainly based on the achievable return temperature reduction in the high temperature network and also the share of supplied heat from the supply pipe. So how much heat you would still need from the supply line and not the return line. And our analysis also started like was based on a comparison of the effects from cascading compared to when you connect this sub network directly to the supply line. Then for the operational dynamics analysis we use the tool that Hanne presented before. So this was conducted in Daimler and here the focus was more on off design cases. So cases where for example the mass flow in the return line of the main network would be really really low. And we work on analyzing the impact this would have on supplying heat to the sub network.
Yeah, so there we were looking into dynamic changes of the input parameters like ramping up and down temperature levels and also mass flows.
And finally the economic analysis, this was based on the results of the static analysis. And it considered the effects of improved efficiency of the heat supply technologies. So as the return temperature reduces heat supply technologies, their efficiency increase and this can be, this has an economic benefit. So our calculation is based on the reduced return temperature reduction, the supply mix of an existing network and some cost reduction gradients that are taken from the publication stated down below. And with these three parameter combination we can actually calculate some economic benefits. And in order to do so we would need supply mix and some data. And that's why we applied this to the case study of Nordic City. Okay, off to some results. So. So as we heard before, and that was also why we looked into it, there were some barriers regarding for example the connection point, meaning that the available mass flow in the return line of the main network. And we found that this is actually also really crucial. So for example, if.
You locate your sub network very far away from the heat generators, then there might be the case that the mass flow in the return line of the network, the main network is too low to enter actually supply the heat demand of the sub network and therefore you would need mixing from the supply line and the positive effects would be lowered. So therefore an optimal location would be close enough or like say closer to the heat generators, ensuring enough mass flow. However, therefore, if you put it closer to the generators, the effect, the positive network effects, for example the reduced temperature losses or heat losses, they are reduced because the distance, the time that the water or the distance the water has that lower temperature is lower if you're nearer to your heat generators. Low mass flow also resulted in hydraulic issues when we were looking into the dynamic assessment. So as I said before, we had an assessment case where the mass flow in the main network was reduced to almost zero. And in this case it happened that.
Let'S say the outcome of the cascading substation with what is feedback fed back into the return line. This kind of had a higher pressure than the water from the main network return line. And it was like a flow reversal where the water was sucked into the inlet of the cascading substation again and therefore the local return temperature was decreased drastically. And then like self, it was like.
It didn't, it didn't result in a good, in a good way. So that is something you would need to.
Prohibit. So therefore, yeah, you would need to ensure sufficient, sufficient mass flow in your return line apart from the connection point. And therefore the available mass flow. Also the temperature levels are decisive for the achievable return temperature reduction. And here on the right you have a graph where you can see.
On the Y axis the achievable return temperature reduction in the main network depending on the return temperature of the main network. And as you can see, obviously if you increase the return temperature of the main network, then also the achievable return temperature reduction will increase until the point where no mixing from the supply pipe is needed anymore. And then a further increase in the return temperature wouldn't have any more benefit. Let's put it that way. However, not only the main network return temperature is decisive, also the temperature levels within the sub networks are of relevance. So we compared three different temperature combinations similar to what Hanni did before and and you can see, for example, for this case we have a return temperature in the main network of 55 degrees. And for the three different temperature levels, different levels of achievable return temperature reduction. However, what is what should be noted here is that for the case of 55 degrees, no mixing from the supply line would be needed for the sub network with 55 degrees. However over 50% would be needed for the sub network with a supply temperature of 65 degrees. So therefore especially for lower main network return temperatures, the sub network temperature levels are really really relevant.
Okay, so we also looked into the effect of multiple networks cascaded in 1 high temperature networks and 2 different implementation methods. So on the left you will see the effect of, let's say a graphic representation on how we connected multiple sub networks in different network branches, meaning at different locations in the main network. So therefore each sub network will only use a portion of the available return flow, cool it down a little bit, feed it back into the main pipe and therefore only step by step slowly decreasing the return temperature of the superior network. This results in overall more sub networks that can be supplied with the same infrastructure without needing to mix in supply. And yeah, it results in overall higher temperature reduction at the heat supply units. Contrary to that, if you cascade more sub networks in the same network branch, meaning like closely in the same area of the main network, then each of these subnetwork would only use a portion of the available flow, cool it down further as it is smaller mass flow and the degrees in the temperature reduction would be really high. Also already after only a few sub networks, therefore mixing from the supply would need to be added sooner resulting in lower overall return temperature reduction.
Okay, and now to the case study and therefore to the more economic or techno economic assessment. So we had a case study of a Nordic city where there is an existing high temperature network and newly planned residential area that is Capable of, of that the buildings are built that are capable of low temperature heating. And this would be our low temperature sub network. The analysis that we conducted is based on the static method presented before. And on this results the economic assessment. Again as we use the static model, we have the simplified linear network topology and the time resolution is monthly.
To actually gain some results, we needed to assess the heat supply system and we assessed the current supply system. However, as you will see, the results are really marginal with this. So we're also looking into a more like prospective, maybe future heat supply system where the effects are way higher. And additionally we calculated some maximum allowable capex. So meaning that of the savings that can be gained through the cascading connections, how much, like how much if you accumulate it over time, how much is the cascading connection allowed to be more expensive than a standard connection? Yeah, well, on the right you see the network parameters. So for the sub network we were fixing the supply temperature to 60 degrees and the return temperature to 35 and the main network temperature. You can just see the points up here, how they, how they evaluate over the year. And on the lower graph you see the according the respective mass flows in the networks.
So yeah, that would be the results. So on the left you see the supply systems of the network that we were looking into. So on the top half, the current supply system mainly based on waste incineration and heat only boilers to cover the peak demand in winter times and also additionally some small waste heat integration, however that is so small you can't even see it. And these systems with these technologies, the cost reduction only due to reduced return temperatures and therefore high efficiencies of the generators are really marginal. And that is the reason for this, is that while combustion technologies without flue gas condensing or CHPs, they don't really benefit from slightly reduced return temperatures. So only if they would imply flu gas condensation, then the smaller return temperatures would actually have a benefit. So therefore for this system, unfortunately the benefits aren't that high when we're looking into higher efficiency of the combustion of the supply technologies. That's why we came up with let's say a model, a future supply system strongly based on the integration of waste heat, some heat pumps, CHP to cover the peak demand in winter times and some small integration of solar thermal in the summer. And with this however, then we can achieve really, really great results, seeing that the annual total savings would amount up to about €70,000.
So yeah, we also calculated, as I said before, maximum allowable capex of this cascading connection compared to a standard connection only taking into account the savings from the gained efficiencies and as you can see for five years payback time we would for the prospective supply system we would almost get a maximum allowable capex additionally to the standard connection of €300,000.
Okay, coming to the conclusion. So the question, well, if cascading subnetworks can be a starting point for the transition of high temperature networks to fourth generation. Yes they can. However there are some technical difficulties, as I said before, some reversals that can happen. So therefore you need to really design your implementation rather well.
The supply temperature of the main network and also of the sorry of the sub network and also the return temperature of the main network and the available mass flow. They are key parameters for successful implementation and you really need to match your situation and as you just said before.
The economic benefits, they are especially high in networks with non combustion heat sources and therefore as I was said before as well. So what Hande said, cascading is probably not like a super simple solution that you can put anywhere. It's rather very specific and depending on your current network and the specific network conditions. So therefore it may be scalable but it's not necessarily that it is like the best solution for the transition to fourth generation systems. And so that was my last slide. As it was said before I have some links for if you want to read further information about our project. There's a link to the project website where the final report should be published soon. And also the link to the publication Anna mentioned before is in here if you want to read more about what we did. Thank you very much.
Thank you. Stefani.
Are there questions for Ned please?
Thank you for nice presentation.
So when you talk about like future energy supply system like consisting of solar thermal and waste heat. So where do you tie in this system? Is it like the reheating of return temperature from sub networks or is it like the heating of the main network?
Well, it can be both. What we were looking into was like substituting the actual supply units of the main network to this to these renewable sources as like an implied like model case. So that is not like what you did what we actually would expect. So therefore let's say for our sky case study the effects were so marginalized that okay, maybe we want to look into what what could be a different case and therefore we designed this future supply system. Maybe in reality you wouldn't have a network already that is so solely relying or like in that case solely relying on These renewable sources. So therefore the effect of other networks might be somewhere between the very low results and the very high results. But yeah, sure you can, you can implement these renewable sources also really in your subnetwork as like utilizing the already existing low, low temperature difference and. Yeah, exactly.
And I mean that's what I think because. Because solar thermal and especially waste his temperature are a bit restricted by like where you can provide either in main network or.
Exactly. But I mean in the end at some point also the high temperature network would need to integrate it. Right?
Yeah, that's true. I mean. Yeah. Second question, very small one. You showed one graph where you have like main temperature. For the case study, Nordic City, you have main temperature supply temperatures. Right. And it increases. It increased in summer and it was slightly lower in winter. And I. Shouldn't it be vice versa because flight temperature are linked to climatic curve and ambient temperature.
Yeah, I mean if you follow the presentation from Hande before, it was the same data that she used, only differently aggregated. And this is just the data that we had from this network where also in the summertime still needed some high supply temperature for this specific network branch. So maybe it wasn't the best representation of the case, but this is just the data that we had available. So in general you're right, they would be lower in summer and higher in winter.
Of course.
Okay, yeah, thank you.
Thank you.
One more question from Eva.
Ah, from Iker.
Yeah, I wanted to ask.
Just like have you seen like such systems where you have implemented multiple kind of sources like you mentioned in the picture, there's a Sun, hp.
CHP and so on. Do you think is it possible for them to exist in reality in one kind of system without using some kind of.
Prediction and future forecast somehow balance these systems? Because in models we can do it, but in reality it's more complicated. Good question. Thank you very much. Yeah, actually there are systems that are integrating different sources. For example, I mean I think it was Copenhagen where they have. I mean still there are systems where CHPs of course produce the main source, the main amount of heat. But you can integrate other sources. However. Yeah, the integration will be more challenging and there will need to be some kind of coordinating activities. For example data, the district heating system in Denmark or in Copenhagen, they have like a heat market app where. Or like not an app but like a heat market tool where they actually like where each producing unit needs to supply their production capacities for the next day and therefore like they.
Attributed like.
The cheapest source will be supplying the network. So I mean of course, fluctuating sources. The integration will be more challenging. So you probably would need also like higher amount of heat storage to fully integrate these things, these renewable sources into network. But it's doable, of course. And there are some examples.
We have a little bit time you can ask.
Okay, thank you for the presentation and I will have a question, maybe not directly for you, but for the whole.
Team of the project.
Continuing the question from Michaelis is.
Question.
About the modeling program that you used and is it planned or is it possible in the future to also do the same modeling by the dis reheating operators? Is it too complicated to model such system? Or maybe in the future they would be able to analyze if some of the sub network would be available for.
The low temperature this reheating system.
Well, I must say that the dynamic analysis conducted in Daimler that wasn't done by me. So maybe Hanne can say something about the complexity of these things. But in general, I mean, if there is a good representation of the district network, I wouldn't see why it shouldn't be possible. But of course it's challenging. But if there are some experts working at the district heating company, I guess they could do it also by themselves. But maybe if Hanna is still here, she can also comment on this question on how challenging the modeling with Daimler was.
But actually maybe if I can add that actually there are already realized not much. Because when we made this definition we tried to find and there were some that partly covered by this definition or can be considered and about five or six. And we have another paper already published year before about case studies. So it is implemented. But again, unfortunately. Or not unfortunately, but it is rather niche solution. But for our Latvian Estonian condition we could do it just tomorrow. It is rather cheap what is very important and to give get results especially in Riga, where you have natural gas, really big share of natural gas. Because for Estonia it was rather problematic just to prove it, because we have biomass based and mostly. And that's why the CO2 emission reduction was very small. But for fossil fuel based district.
I have question which I put for Hannah. Unfortunately I did not receive. And she promised that you will do it. I did not receive this answer. Could you please explain? Because I think that in technical economic calculation you have to put CO2 value from emission trading from taxes. It is.
I think that it could be explained by you, please.
Yeah, unfortunately I must tell you that we actually didn't look into the effects of CO2 emissions. But maybe that can be something for a next cascade project. If there will be one.
But you said Amaya, you had some calculations done before?
Actually yes, we had calculations for. For a case study in Estonia again and we based on this primary energy reduction and actually.
Two main positions, how can it be reduced? Why it reduced? First of all it is heat loss reduction which is not very high, but due to this.
Cascade in this small sub.
Supply temperature is lower than it could be if just directly connected.
Yes.
So in this small network these heat losses would be lower and return temperature would be increased. So in all network these heat losses will be reduced. So it will influence. And another case it is flue gas condenser and CHP where efficiency would be increased due to this small reduction of return temperature. But if we have large network it would just give exactly primary energy resource reduction. And in case these resources are fossil, in this case CO2 will be reduced. And in addition actually the idea of this cascade that for these small low temperature networks some local or small renewable energy solution can be used and it can be used as backup or together. So but yeah, this. And we have one paper, it was admitted as the best technical paper yet before I can send you links. So we have some concrete data, but based on concrete case study, but not in this case, unfortunately. But it was their work package but they decided to present it this way. Thank you. Thank you for a question and I think yes, we are very good in time because we don't have one presentation. And thank you very much for your presentation and answers.
And our next presenter will be.
Another good partner from another consortium that we have with Riga Technical University, with Dalarma Hochschule and with Lithuanian Energy Institute and Paltec. It is supported by Nordic Energy Research and related with fifth generation district heating cooling. And Lina Murauskaete from Lithuanian Energy Institute will tell about suitable business models to promote such type of of district heating. And this research was prepared together by Eva Pakere, by Anna Volkov, a little bit by Marika Katsar and Pei Huang and Lina Murawskay, Please, floor is yours.
Thank you.
Yes, I have to do this.
So I already presented all our consortium from Baltic states and Sweden. My name is Lena Moroztaete and I am from Lithuanian Energy Institute and I will talk about the next generation of this reheating. Up till now we were talking about how to move from the third generation to the fourth generation. And I will talk more about business models for the promotion of fifth generation district heating.
So I would like to start with the definition what is district heating.
Of fifth generation is ultra low temperature. Heating which needs heat pumps to increase temperature for the tap water initially because the temperature level below 40 degrees. And we are talking both of heating and cooling network. We can include in this network waste heat from the shopping malls or from data centers as well as electrical transformers which uses electricity and just waste that heat to the atmosphere. By the help with heat pumps which supposed to be installed in each of the consumers houses or commercial buildings. The temperature level is increased and what is also necessary is heat storage to keep the level necessary for each of the consumer. So we try to look into more theoretical point of view. How can business management theory help to make a decision for such a complex situation when we have different consumers, producers and even prosumers. So we found that game theory that applies mathematical models to estimate behaviors. Operational agents could fit very well into this decision making system because it simulates real life events. All agents are beneficiary at the end because they are complementators. And even at the beginning some of them could be competitors. At the end we reach coopetition situation. Then synergy created by extra value of each participant is done and each of the participants is moving to Nash equilibrium. Which means that at the beginning everybody starts the movement without knowing what others are making. But afterwards then we evaluate the situation, they know the situation better and reach the equilibrium where we move from the competition to the cooperation situation.
And workflow of our research was started. From the literature review we identified three main groups like fifth generation distributed heating, business management and game theory interrelation. And we made a methodological scheme. As you might see, we start from the assumptions that are based from the preliminary research already available. At the beginning we need to make risk and benefit analysis which connect identify and weight factors of all process and it is based on the existing switch. What metrics already? In the next step we evaluate a network which means all the interconnections and variations of actions. By including my previously mentioned co petition principles as the basics. Then visualize what we have by drawing conceptional schemes, analyzing the choices. The most important who will start the game by installing fifth generation district heating and therefore process flowchart is drawn. And in any stage of the process there could be a cancellation of what already has been done because it's not profitable in the long term. And for the final evaluation value scale is used used from 1 to 10.
For the fifth generation this reheating prosumers became a key player because it's an ultra low temperature network. And we need to use waste heat from data centers or shopping malls or renewables as a Support source because it's very cheap and just to decrease the required initially high investments cost prosumers became key players in the third generation district heating. Without the prosumers the such network would not exist because it would be not competitive with the existing heating network. And the only risk is that prosumers might push the equal prices for heating and cooling both. So in such a condition it could be that heating become more expensive that you are available to cooling at the same time. So you have either benefit and.
Risks.
At the same time. So we analyzed three scenarios. First of the scenario is thermal energy purchase agreement where distribute heating company operates the network and is responsible for the investments and support funds available from the government. It's district heating company's responsibility to maintain the network, all the infrastructure and to make the investments. And the modification of this scenario is when district heating company not only owns the network but also produce part of the energy required by heat consumers. In this case the owner has the highest business potential and at the same time the greatest financial risks because the owner put the business interest first. The next scenario is local thermal energy provider which means that in this case the network of heating cooling is owned by the real estate company.
The company of real estate in this case is responsible for all investments and operation of the network. And it's more suitable cases for small scale projects where real estate companies would have really strong interest to maintain the network and to make all the investments themselves. And the last scenario is local thermal energy communities.
It is very bottom up approach.
Because when community owns and operates the network themselves, they are more interesting to have as low price for heating as possible. They are motivated by self interest. They.
Have the main risks that the management of the network in a long period of time might be complicated and unsustainable in this case.
So starting game theory from the beginning, the most important question is who will start the game. It could be either consumer, either producer or prosumer. From the consumer perspective, the most interesting questions about the management of the network itself. From the prosumer perspective, how much energy do they have and the payback time of the investments. And the producer or operator perspective, the evaluation of business potential in the future is the most important. At this preliminary risk assessment.
Stage and after the first stage project could be canceled because the initiative of installing fifth generation DC heating might not generate expected payback period or enough energy for the continuation.
From the consumer perspective, they might think that external business might be needed for management that network. And from the producer perspective they might think about different maybe location of the expected network. And.
Then it should be made the main decision who will own the network. It will be from the consumer side, from the producer or ownership of the network. And the next stage is the chosen exact project risk assessment by calculating the tariff itself, including all taxes, legislation, existing fuel costs, is it fossil fuel or renewables? Also, heat and electricity prices play an essential role here because we need a heat pump which uses electricity. And after this stage again we can cancel a project because it doesn't seem financially possible. And at the end we are building infrastructure and finally implementing fifth generation district heating. After the implementing value at scale, as I mentioned before, we use scale from 1 to 10 based off technical characteristics of the equipment.
The coefficients they are very approximate and more based on the weight from each of the participants in the fifth generation district heating. And the numbers could differ in every case. One of the example is the base scenario for traditional district heating. As you might see at the end prosumer in total they have only lots because they are just paying for the energy they need. But in this case they do not sell any energy, so they do not have gain. So they compare this base scenario to all those free scenarios and just avoiding those matrixes of numbers. I'm going directly to the conclusions that in the Baltic states in general, the main barrier for fifth generation district heating implementation are well maintained and widespread high temperature district heating network at the moment. So fifth generation district heating could be implemented just in newly built areas as decentralized system and complement to the existing third generation district heating systems. And in the future expected that energy communities will take the higher role in the systems and the most beneficial for the society would be implementation of energy communities. But in the long term, lack of professional management of the network might be a weak point. And also I can stress out that governmental support itself can significantly change the equilibrium, especially CO2 price and the system in which we integrate those food generation district heating. Because if we have fossil fuel based disheating and we have high environmental cost, when it becomes beneficially and financially possible, and in this case fifth generation, this reheating could be considered. So my last slide is acknowledgement for Nordic Energy research, for funding our project and for letting us to collaborate with our colleagues from Estonia, Latvia and Sweden. Thank you.
Questions?
Okay, maybe I can ask what I don't know.
Can you please comment on this game theory and what is the specific of fifth generation district heating? If we compare with any are the type of modern distributing solutions. So what is special for this game theory which is related? You mentioned prosumers or something? Maybe yes.
Game theory is very good tool. When you are in the decision making process and you have many uncertainties at the moment, you're lacking of time. You don't want to make deep calculations, exact numbers of each technology. You just know approximately which is more expensive, which is less expensive. You allocate the particular values for that and then you have the result. Is it profitable or you have a loss. And you should start at the beginning even and then just at the later stage you can make a very clear calculations on a particular case study.
So you compare it with the. With other. We have some question.
You compare it with other modern technologies or with current the traditional DC heating.
System as a base scenario. And then those three scenarios are presented.
Please get some more details about. Thank you. Thank you very much. If there is no question. So thank you, Lina.
And our last today presentation. Within this section, not within conference, we have one more section, but before lunch. And it is research developed by Riga Technical University researchers Viveta Prietny. So vladimirskirsanus, Ivar Swedenberson, Dagnia Blumberga and Viveta Priednica will tell us about emissions and efficiency limits of small scale biomass heating system. So regulation standards, echo labels. Please leave it. The floor is yours.
Thank you for the introduction. And yes, I will step away from district heating a bit and I will focus on the emissions and efficiency limits that are stated in different regulations and also echo labels in European Union. And that mainly.
The main reason why we wanted to study these documents is because the household sector is responsible for around 1/3 of particulate matter emissions.
Of total energy resource consumption in Latvia and household sector. This heating equipment uses wood products that are major sources of particulate matter emissions. And in 2020 the household heating and cooling equipment was responsible for around 49.5% of particulate matter emissions and.
PM10 emissions and around 58.3% of PM2.5 emissions.
These are quite high numbers and therefore we decided.
We established the aim of the study which was to determine the level of existing control measures regarding household boilers by summarizing the existing information on legislation and quality labels that are regulating the efficiency and emissions of household boilers in the European Union with a focus on particulate matter emissions and the system heating small scale heating system regulations in Latvia and the studied legislation documents include the regulations of the Cabinet of ministers number 17, which are enforced in Latvia and they focus on limiting air pollution from combustion units. Then there's a couple of European Union Commission regulations, one that's focusing on implementing ECO design requirements for solid Fuel boilers and the other one that's focusing on energy labeling for solid fuel boilers with capacities up to 70 kilowatts. And the fourth major document that was studied was the European Standard on heating boilers part five, that focus on.
Heating boilers with capacities up to 500 kilowatts. And in this standard, the boilers are divided in three classes according to their capacities, where the stated efficiency limits are 82, 84 and 89%.
And we studied four ecolabels that control emissions of either wood stoves or heating boilers, and one proposal to include the heating boilers in the European Union ECO label where they are not yet included. And the four studied labels were the Blue angel ecolabel which is used in Germany and is developed on the previously mentioned European standard, the UZ37 criteria that is used in Austria and is indeed applies to wood stoves and heating boilers. And then there's the Plume Verte ECO label that is used in France and it applies to heating boilers with efficiency up to 50 kilowatts and starting from 50 to 70 kilowatts. And what has to be mentioned here is that emission requirements in this Flamo Verte ecolabel are much lower than in other ECO labels that are used in European Union. And the final label that was studied was the Nordic Swan ECO label which applies to heating boilers that are simple combustion systems with capacities up to 500 kilowatts.
And to better compare the results, we decided to divide the efficiency requirements in these labels separately for pellet boilers and for firewood boilers. And in this figure you can see the requirements for pellet boilers where the highest requirements are set in the Austrian criteria in this, in this upper line it's this UZ37.
Label where the efficiency of the boiler has to be at least 90%, while the lower, lowest efficiency efficiency requirements are set in the European Standard Third Class Eco Design Directive and also the EU Eco label proposal. And overall these efficiency requirements are from approximately 67 to around 90%.
And as for firewood boilers, these efficiency requirements are lower. And here you can see that the strictest requirements for efficiency are stated in in the European Standard 5th Class and the Nordic Swan Ecolabel, closely followed by Flammavarte. And these ecolabels require that the efficiency of the boiler has to be above 85%. And similarly, as in the case of pellet boilers, the lowest efficiency requirements are stated in European Standard Third Class Echo Design Directive and the EU Echo label proposal.
And for particulate matter emissions, we summed up these requirements together for both boiler types and as you can see, most of the results and most of the requirements state that particulate matter emissions should be below 100 milligrams per normal cubic meter at 10% oxygen content in flue gases. But there is one requirement that stands out and it is set in Ministry of cabinets regulations number 17 for existing solid fuel boilers until 2027. And as you can see, the requirements later for these in these.
Regulations are lower. So it's for these remaining five years these high requirements are still in force.
And to better highlight the necessity to reduce particulate matter emissions, we decided to calculate a couple of indicators where we accounted These particulate matter 2.5 emissions to number of people in the country and to gdp. And we compared this data for the Baltic countries, the European Union and the countries whose ecolabels were studied in the paper. And as you can see, Latvia has the highest value for both of these indicators at 6.1 thousand tons of particulate matter emissions per million people and 354 tons of particulate matter emissions per billion euros. And the lowest.
Indicator values are for Germany, while European Union in general has the values of around 1.4 thousand tons of particulate matter emissions per million people and.
41.9.
Thousand.
Tons per of particulate matter emissions per billion euros.
And the main conclusions from this comparison of different requirements are that there is a necessity for stricter emission control for small scale heating equipment and in particular for particulate matter emissions. And especially in Latvia. And as shown by the results and examples of these study DECA labels and the countries that use them. The sustainable labeling of energy products and additional emission control measures are the key to significantly improving the control of emissions not only in the household sector, but in the whole country.
Thank you.
Maybe.
What I like. Okay.
I have question maybe or maybe you could clarify to me. So actually if we speak about European Union labeling. So we have it. I don't know for some chemicals for different this type and it is based on life cycle assessment mostly. If I'm not mistaken.
At the moment there are no labeled boilers within this system or in some countries there is such label because there are different groups of products and I don't know there are boilers labeled using this European Union labeling.
Well, there are different like these labelings. The European Union ecolabel.
Yes, with this.
With flour doesn't include heating systems at all.
At all. Such procedure doesn't occlude.
There are several proposals to include them, but they are not yet accepted. So it's still in process. And the energy labeling that is for these small scale boilers. It's basically based on this European Commission regulation that I mentioned, which is dividing them basically in these energy classes and according to their efficiencies. That's the one that's for now existing in the European Union as a whole. And then there are the several different labels that are used in some countries.
Because you showed this energy efficiency. Yes. Recommended this and lowest for this flower for ecolabel. But it. Based on what? How you did it. Based on proposed.
Based on the proposal.
Yes. That include. To include. Okay, thank you. Are there any questions? If. No. Thank you very much for participating in this session. Thank you. And we will have now lunch break a little bit longer, but we wait you back at one o' clock to even more interesting session which we moderated. Barana Kubola, thank you.
More from IEA
XIV-05: Flexibility and DH value chain (FlexVal) – advanced analysis & compatible pricing
XIV-04: RE-PEAK - How to cover peak loads in district heating networks with renewables.
Digitalisation of District Heating: Summary of findings from IEA DHC Annex TS4
25/01/2024: The crucial role of district heating pipe lifespan in achieving climate objectives
IEA DHC XIII-03 Generation of simulated faulty datasets to ease heating network fault detection
XIII-01: Leave 2nd generation behind: Cost-effective solutions for small to large scale DH networks
XIII-04: Cost Benefit study on the building secondary network for improving DH performance
XIII-05: OPTiTRANS - Optimized transition towards low-temperature and low-carbon DH systems