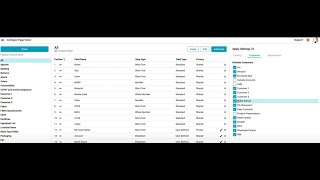
0:48
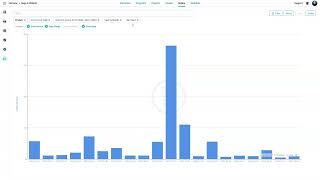
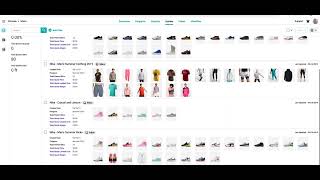
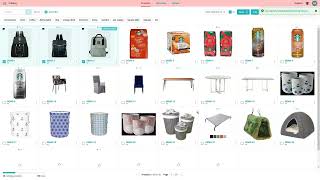
A walkthrough of ShareFront's analytics tool. Click the plus sign to add a chart, select your data type and source, set a date range, choose your view and chart type, then name and save it. Use Delete to start over if something goes wrong.
Chapters
More from Luke
youtube.com
THE COMPLETE GUIDE TO PLM IMPLEMENTATION I PART 1: SHOULD YOU INVEST IN PLM SOFTWARE? (4K UHD)
2y ago

youtube.com
THE COMPLETE GUIDE TO IMPLEMENTATION I PART 2: HOW TO PURCHASE THE BEST PLM SOFTWARE (4K UHD)
2y ago

youtube.com
THE COMPLETE GUIDE TO PLM IMPLEMENTATION I PART 3: HOW TO IMPLEMENT PLM SOFTWARE (4K UHD)
2y ago
See all content