Retail News - Consumer Demand and Weather Webinar
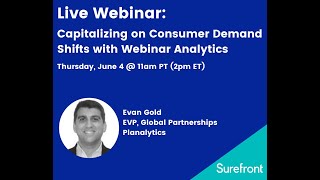
The webinar, hosted by Dylan Lowe of SureFront and featuring Evan Gold of Planalytics and Doug Heckman of SureFront, explained how weather analytics—specifically the Weather‑Driven Demand (WDD) metric—can be used to improve retail demand forecasting, inventory allocation, marketing timing, and supplier‑retailer collaboration during the COVID‑19 disruption. Gold described Planalytics’ methodology of pairing multi‑year point‑of‑sale data with precise weather observations to quantify the lift or drag that weather imposes on each product, location, and time period, producing a single, actionable “weather‑driven demand” value. He highlighted the business impact: up to 30 % forecast accuracy gains, 2‑6 % net‑income improvement, and better inventory, labor, and promotion planning. Real‑world case studies showed how weather‑aware alerts helped suppliers increase in‑stock levels, boost top‑line sales, and explain promotion performance. Heckman demonstrated SureFront’s collaborative platform—central product catalog, in‑app quotation builder, real‑time chat, and upcoming light‑syndication export—to let suppliers share weather‑adjusted insights with retailers quickly and securely. The Q&A covered subscription options, sector‑specific use cases (hardlines, softlines, home décor, restaurants), forecast horizon reliability, and how long‑lead‑time supply chains can cleanse weather volatility from historical data to plan months ahead. Attendees were offered free trial seats and follow‑up resources.
Chapters
All right, so welcome to SureFront's weekly webinar series at 11 AM Pacific. I am your host, Dylan Lowe, the Director of Marketing at SureFront. And for those of you who are new to this webinar series or are not familiar with us, SureFront is an all-in-one app built for suppliers, showrooms, and sales reps with a patented immersive collaboration technology which empowers users in a variety of ways, including allowing you to create virtual showrooms and showcase your product lines to retailers anywhere at any time, which is Really important right now since you can't actually physically meet with people, or very limited at doing so. Also giving you the ability to collaborate and chat with retailers on quotations, buying programs, and purchase orders without ever leaving the app. And we'll discuss that a little bit towards the middle of this presentation. Really powerful tool, in-app chat. And then also even allows you to work with your manufacturers and factories on product development. So we hold these webinars every Thursday at 11 AM Pacific. To provide valuable information to our retail community to help them get through this crisis. Today we're discussing how you can capitalize on consumer demand shifts using webinar analytics, especially during COVID-19. So we're also going to have a Q&A at the end of this. So please start asking any questions you have now in the Q&A icon at the bottom of your screen. I know there's a chat icon, but if you can stick to that Q&A icon, that would be super helpful. And in addition to having these webinars to help our community during this trying time, we're also providing a limited number of free seats for the SureFront app on a first-come, first-served basis to all attendees after this webinar today. So please look for that email. We're trying to do everything we can to help our community during this trying time. And our panelists today are Doug Heckman, who is the Director of Product at SureFront, and Evan Gold, who has spent over 25 years in the retail and wholesale industries. His current role is the EVP of Global Partner Partnerships and Alliances at Planalytics. And prior to joining Planalytics, Evan's executive experience was at Macy's in retail management consulting. So he has a ton of experience in the retail world and industry, a lifetime of it. So we're very excited to have him in here today. So thank you, Evan. I'm going to hand it off to you now.
Great. Thanks so much, Dylan and Doug, and, and for the opportunity to join today. I'm going to share my screen. Let's see how that goes. Hopefully you can— I'm loud and you can all see the screen okay, Doug and Dylan? Yep, we're good? All right. So, and again, thanks for the opportunity to join today and welcome to the webinars. As Dylan said, the topic is capitalizing on consumer demand shifts with weather analytics. And again, my name is Evan Gold. I am part of the partnership team here at Planalytics. Let me also thank everyone in the audience who's taken the time to join us today. It really is an honor and a pleasure to be here, so thanks for the invitation. And let me begin for everyone that's on today to express my hopes that you, your business, as well as your personal and professional families are doing well, keeping safe, staying healthy in the current environment, which really is unlike anything that we've experienced before. And, you know, I know there's a variety of folks that are on today, regardless of whether you're a retailer or retail supplier or solution provider. There's something for you in, in today's content. I'm going to be talking about a topic that is near and dear to so many of us. It's one of the most local and directly influential in terms of how it affects our daily lives, and of course I'm talking about the weather. And in today's webinar, you'll learn how the weather, and more specifically weather analytics, can be harnessed to bring profitability to your business. So thanks again for joining today, and and let's dive in. Okay, there we go. So we know that as business leaders in a typical environment, you have a lot of factors to consider when you're managing your business. Some of them are internal like product, price, promotion, and there certainly are a lot of external factors, exchange rates, consumer confidence levels, and the like. Now obviously today coronavirus is top of mind because it's having such a notable impact and also influencing those macroeconomic variables like employment rates, gross domestic product. But when you think about the macro environment, all of these things are unknowns, right? There's a lot of unknowns that are out there right now. But as we move through the content today, I wanted to be clear that the weather is not one of them. Weather, in fact, is a known impact. And we're going to share some analytics as well as some insights today that you can quickly and effectively manage your business in a scalable and sustainable manner. And the reason is because weather influences us all as consumers. On a typical day, it affects what we wear, what we buy, the channels we shop from, even affects our mood, right? Today we're talking about the weather from a business perspective, more specifically how it influences your business, because it has a consistent and ongoing effect on consumer purchasing patterns. Now when we think about the weather, we often map to the major events, the snowstorms, there's a hurricane actually, or a tropical event that's going to threaten New Orleans here in the next couple of days, uh, polar vortex floods, all of those things. And yes, they definitely do have a significant impact, but even more important are the day-to-day, the week-to-week, the month-to-month variations in the weather that dramatically impact both top-line sales and profitability. In fact, Over 90% of the weather-driven volatility in your sales are the result of those typical day-in and day-out changes in the weather. Was it warmer than normal, cooler than typical, wetter, drier? This is even more true in the current environment that we're living in. And the reason for that is because the weather influences consumers in terms of what they buy and, and when consumers purchase, how much they purchase, where they go. It covers all sectors of retail as well as consumer products, restaurants, entertainment choices. Now, over the last few months, as the impact of coronavirus has really overtaken a lot of our activities, you know, initially we were focused on the basic necessities, right? So for those of you that remember your high school psychology, you think about Maslow's hierarchy of needs. The bottom portion of that was, was physiological and safety needs. And certainly that, that includes products like toilet paper and cleaning cleaning products. But in addition to those basics, the weather has and continues to influence need-driven purchases. So for example, back in February and March, you know, where I am in Philadelphia, a lot of consumers were not only focused on stocking their pantries, but what were you buying, right? It was still kind of late winter. It was cold. So we were buying soups and stews or blankets and sweaters. Now as we're getting closer to and really into summer, the same consumers are focused on different categories, right? So the need-based categories now are outdoor grilling or summer apparel or lawn care, things like that. So while again the coronavirus is impacting us all significantly, the weather continues to influence our shopping behaviors and what we're putting into our shopping baskets. Now again, when we're talking about weather, right, I think most folks initially map to weather data, right? And weather data is widely available. It's on our phones, televisions, every media channel. Channel you can think of, right? And from a personal perspective, it's perfectly fine for each of us to make our own decisions every day in terms of what do we wear, can I go outside, those type of things. But from a business perspective, it's not usable, right? And the reason for that is, first of all, weather data is subjective, right? It's also emotional, right? And frankly, weather data has been, you know, used by businesses, you know, for a long time without any success, right? The reason for that is because weather data is inefficient and you can't really scale it. You can't scale it at all. So our mission, our sole purpose at Planalytics is to make the weather actionable. Quantifying the lift or drag that weather brings on the business so that you can profit from it. And that's the business we're in. That's what we've solved for everybody that's on the phone today. The quantification of the impact of weather for every product, every time period, and every location. So it not only provides the answer to weather's impact on your business, but it provides it in a fact-based, single version of the truth solution that's actionable, scalable, and sustainable. So again, the only way to do this is to have access to the analytics around the impact of weather, not necessarily weather data, right? There's a big difference, I think, as we all know, between data and analytics. So what we're gonna be talking about today is weather analytics, and I'll give you a very brief background for context on what it is, and then we'll talk about how it can bring measurable value to your business, even some examples, as well as some case studies. So while we're talking about, again, the analytics, it does definitely begin with data. But it really begins with consumer demand data. So Pointalytics does the heavy lifting on multiple years of sales data to understand and correlate the impact of weather. Now we do this by analyzing multiple years of, again, historical sales data and aligning it to the same time and location where that weather took place when the sale took place. So we do that heavy lifting whether it's point-of-sale data that's provided or industry data sources. So we're partnered with folks like Nielsen and NPD as a source for industry data to understand those demand trends. So we marry the weather data up at the place and time to the location of the sale to understand that relationship that the weather has on demand for every, for every item. So the output of that analysis, without getting into a ton of detail, is what we call weather-driven demand, or WDD for short. So the WDD is the metric that represents and quantifies the impact of weather, again, for every product, every time, every location. It's that single version of the truth that quantifies the impact of weather in a manner that's easy to understand, easy to communicate, as well as easy to action. So one of the key reasons, again, why analytics are paramount to weather data, right, is this concept of weather sensitivity. So regardless of what product that you sell, right, there is a typical, a normal sales curve that you have, right? And there's a variance around that sales curve that's attributable to weather in any given year. So the weather sensitivity is essentially what that variability is. But again, it's important to understand that sensitivity is not only unique for every product, but it's unique for every time and location. So use the example where it's— if it's 50 degrees in Minneapolis, we know that that's going to have a different impact if I'm selling, for example, fleece, on the same 50 degrees would have in Miami. Likewise, this 50 degrees in Minneapolis in March is going to be very different than the 50— same 50 degrees would be in, let's say, December. So again, the sensitivity varies for every product, time, and location. So we do the heavy lifting to understand that sensitivity to help you understand when— what changes in the weather are going to result in the changes in demand for the consumer. That's all part of the modeling. And again, it's not just for products, but it's also for foot traffic in the stores or web traffic into websites. So the value of doing this, right? And that's really what we're talking about. Why would you do this at all? What is the measurable benefit to include these analytics within your business, right? It's really around— there's a lot of different values. The core one that our customers find that they're able to measure and quantify with these analytics is around forecast accuracy improvement. So the same way that you would adjust your demand forecast for other variables or events, now think about doing it with the weather, right? And our clients are seeing up to a 30% forecast improvement for individual products. Every year, right, based on the inclusion of these analytics, right? We all know how variable the weather is day to day, week to week, month to month, year to year. So you've got to account for that when you're doing your forecasting. And this is a very not only simple but actionable and measurable way to improve your business. Now it's very common for our clients to experience improvements to inventory levels that are going to drive a 2 to 6% improvement in net income again every year. Right? So it's not only driving top-line sales, but it's improving bottom-line profitability. So a little bit of background there, and I talked a little bit about forecast accuracy for demand planning, but the same analytics can be used for things like reporting and replenishment and labor and marketing. I mean, there's a variety of different use cases. Once you measure something, right, there's a lot of different ways that you can manage it. So happy to talk to those, but I think the focus of today is really to talk through how you can use these analytics from a collaboration perspective. So I want to give you a couple different examples, real examples, and let's start and we'll talk about the retail month of May, which just ended, right? And the map on this slide, and as well as the next slide, has some— the maps are really here for context. And the map on the left shows the temperature change to last year, with the blues and purples depicting colder conditions to last year, and the oranges and reds are indicating the warmer temperatures. The precipitation versus last year map on the right side there shows where it's wetter. You'll see green, shades of green, and yellows and oranges depict conditions where it was drier. So overall, May of 2020 in the US was actually the coldest since 2016. Dylan and Doug, I know you guys are on the West Coast. It probably didn't feel like that. You guys had plenty different weather. But overall, you can see that those of us here in the East— I'm in Philadelphia, and it was a much different May than you guys experienced out West. And when you think about the impact of weather, you've got to aggregate it up appropriately, whether you're doing it store by store or on a population weighting, right? So the fact that it was, you know, cold in New York City is going to matter more than, let's say, Salt Lake City. And I'll get to that example here in a minute. So overall, it was a cold June, coldest in 4 years, but again, you can see the regionality, east versus west. It was also a relatively dry May, the driest since 2018, with the driest conditions in the center of the country, wet conditions you can see in the east and parts of Texas and the northeast. But at the end of the day, what does all of this mean in terms of consumer demand? So these are industry-based models. That show specific categories and as well as individual markets. And the numbers there are those WDD or weather-driven demand values again for select categories and markets. So for example, the weather provided a demand— a lift in demand for sweatshirts overall, but it was higher in eastern markets like Nashville compared to western markets like Phoenix which had a 7% decline. Again, those are changes solely attributable to weather. We know that there's other factors at play in terms of influencing demand. These are the lift or drag solely attributable to weather. So again, a reminder that for every product, time, and location, you're going to see different impacts. It's the same weather, but it influenced consumers differently. And again, because it's an aggregation on population, the impact of weather in a market like New York City is going to be different than Salt Lake City, which is why when you aggregate it up, New York is going to play a bigger role in that top line number. So this gives you a sense for what happened in May. Uh, let's transition forward a little bit and talk about June. And so we're a few days into the retail month of June, and you can see that for most businesses, you should expect favorable trends for seasonal categories. Although there is some regionality, most locations are still going to be warmer to last year and colder conditions in some of those coastal locations. Now, for reference, last year June of 2019 was the coldest June, the coolest June since 2011, and it was the third wettest in 125 years. Now I'm going to guess, right, that a lot of folks on the phone, either if you're a retailer or supplier, if you're planning your business, a lot of times you look at LY as your initial source for seeding this plan for June of this year. If you don't account for the weather that happened last year when you were planning this June, you're essentially planning on that weather to repeat. I just told you we had the third wettest June ever recorded, 125 years, right? That is certainly not going to happen again, and it was also very cool last year, right? So part of this methodology is to remove the impact, cleanse the history from a weather perspective, so you can seed your baseline with a greater improvement in terms of your forecast accuracy.
Have you seen suppliers communicate this to retailers? Maybe a retailer is also forecasting based on last year, but a supplier with this enhanced knowledge can come in and say, "Look, I actually have different predictions for this year compared to last year," and use that as a sales tool?
Absolutely, and you've got to account for the weather because if you don't account for it, you're basically planning on the weather to repeat. And it's volatile. We all know how volatile the weather is, but one thing that is certain, right, statistically, it doesn't repeat year over year. It just doesn't. It may swing from one extreme to the other, but if you don't account for the weather that happened last year and cleanse that, remove it from your history, you are planning on it to repeat and you're inherently building error into your demand forecast. It's a great question, great question. So you can see some of those seasonal categories here. And those weather-driven demand impacts. So managing your supply chain, localizing your inventory levels are real— I mean, those are important things to consider in normal times. And now think about June, right? Much of the economy has begun to or is going to continue to open up in June. Consumers are venturing out of their house. They're making their first trip to the stores or the shopping destination. It is imperative that you or your retail partners have the products on the racks and the shelves to not only meet consumer demand but meet their expectations. So understanding the weather's impact on your business is so important right now because the consumers are in tune to the weather now more than they ever have been before. So as a business, what we're doing obviously is leaning forward with our customers and everybody that we're talking with, regardless of the sector they're operating in, to make sure that they understand and can action every opportunity that's available, right? You just can't let an opportunity slide past in the current environment, right? So as we stated at the, at the outset, the impact of weather is known and it's measurable and therefore provides an opportunity for you to, to capitalize on. So at this point, I want to turn it over— Doug, I'll turn it over to you, or you can grab control. I think you're going to walk through some, some overview of your solution, and I just want to say thanks to SureFront. You guys have been a great partner of ours, and I think what you guys provide is a unique that not only value-added solution, but I want, I guess, as I think about it, the opportunity to collaborate between suppliers and retailers, obviously as it relates to weather-impacted items. And I think, Doug, when you're done, I'm going to come back and I'm going to share some real case studies to demonstrate the power of these analytics from a collaboration perspective. So I'll turn it over to you.
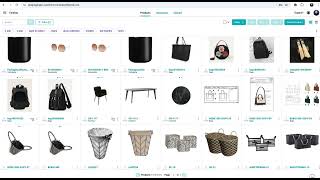
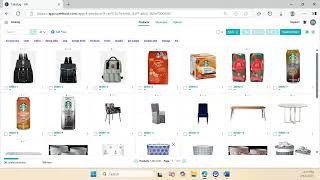
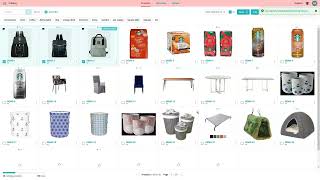
Yes, thank you so much, Evan. I want to just take 5 minutes here to share how SureFront can help empower your team your team to be more agile, to react more quickly to any kind of disruption, whether it be unplanned weather or whether it be something like the coronavirus crisis where you're no longer in the same space or no longer meeting with your customers. So what we see here right now within SureFront is your catalog, which is your central repository of product data. And the nice thing about this is this is accessible for any of your team members anywhere. So if everyone's working from home, You don't have to be on a central access drive or sending spreadsheets back and forth. You and your team members can find the products you want to get in front of your customers all in one easy, centralized way. Also, within this catalog, you have really nice opportunities to find the products you're looking for, whether it's by searching, whether it's by drilling down in your product hierarchy, um, or even maybe tagging across that product hierarchy into different types of product groups. So now what I'd like to do is, is show you when you have products that you're looking for to share with your retail partners and your buyers, you're able to quickly select those products and put them in a format that is not only going to, uh, get your products to those customers more quickly than your competition, but give your customers a better buying experience than your competition, ultimately increase your chance to win. So here you can see I created this new collection called Accent Chairs. I was able to quickly select all of those accent chairs that we might have been working on, whether acquiring or developing. And I'm going to create a quotation to my customer. Let's do this one for Wayfair and say that we want to send them these new accent chairs as a quotation. So now rather than having to reformat or rip data out of one system and put it into a new spreadsheet That takes all of the information out of that central product catalog and it immediately puts it on a quotation that is customizable and individualizable for each of your customers. And it also allows you the ability to select things like this in bulk. Maybe I want to put the quantity for each of these products. I want to start off with an initial quantity of, let's say, 100 of each of these for this customer. And now as we're starting to finalize the details of this quotation, we can adjust pricing, we can adjust terms. You have an ability here within this chat, this in-application chat tool, for you and your team to finalize the details of this quotation and message each other real time. So maybe you have your sales lead putting together this quotation and they need to call in maybe a sales manager to come in and review these details before you're going to send it to your customer. You have that ability to do that all within this platform without having to jump to a different location. Once the quotation is finalized, one of the really nice things within SureFront is whether your customer is already on SureFront or whether they're not yet already on SureFront, you're able to use this tool to really engage them and give them a fantastic buying experience. So I'm going to share this, um, with a new email address, like, as if this customer isn't already on SureFront. Let me type in one for today, and then I'm going to tell them, please check out these new Accent chairs. Fix my typos there. And then as soon as I send this to my customer, again, if they're already on Shorefront, it's going to give them a notification in the application. They're going to be able to jump right into it and see But even if they're not yet on SureFront, I'll show you what that experience is going to look like for them. So they're going to get an email invitation that says, "Hey, you have this new quotation from your supplier." It gives them this awesome visual preview of that information. And again, even if they, they haven't yet signed up for SureFront, all they have to do is click on this quotation. I'm going to open this in an incognito window since I'm already signed in, but as soon as they click on that quotation, It's going to drop them immediately into the platform where they're going to be able to review these nice high-quality images on each of your products. They're going to be able to drill down into specific product details so that they can get more information. And best of all, they can message you directly in the platform, which allows you the speed and agility to engage them as they're interacting with your products, which again will increase your chances to win because you're giving them that concierge-level service that they might not have if they have to type out a new email or follow up with this in a spreadsheet. One other thing, all of these features that we just went through are all live in SureFront. So if you sign up now, you're able to utilize all of those today. But I do want to give a quick preview as well about one of the features we have coming down the pipeline that we're really excited about. And that's this light syndication type feature. So I sent this quotation to my buyer over at Wayfair. We know that these products are gonna have to be set up on their site to go live. And Wayfair and Walmart and Target, they all have separate types of product setup sheets and requirements that they need to get that data onto their website. One of the things that we're working to make live for our customers in SureFront is the ability to take those products that you're already engaging with your buyer in, within the platform, and be able to export them specifically into those customer setup sheets so that both you and your customer can take that data without having to do a lot of manual work and immediately upload it into their online system, which again helps increase your agility and your ability to get things to market quickly. I just want to give a quick preview. What that did is it downloaded a zip file here, and I'm going to open up and show you what that looks like in Excel. So give me a second for this to start. You can see here, this is the Wayfair-specific sheet with all of the product data that we have on those product quotations that we sent to Wayfair. And this is accessible both to you and your buyer. That way, whether it's you needing to set up this information for a certain retailer's online system or your buyer who's decided to move forward with the products that you've quoted them, they're able to quickly get that information in the format they need and then pass it along to their other systems. Which again really gives you an opportunity to stand out amongst your competition. So with that preview, I'd really like to turn it back over to Evan to jump back into how the weather side of things can impact your planning and how you can take action on those with the case studies that you'd like to run through.
Also like to mention, thank you very much, Doug, that we're going to be, you know, sending out an email later today with a free link to the webinar attendees that they can sign up for a surf or an extended trial. So, you know, please take advantage of that. We're trying to do everything we can to help our suppliers during this time with as much free material information as we can. So, you know, please look out for that email and click and sign up today if you can. And thank you, Doug, appreciate it. And I'll give it back to you, Evan.
Great, thanks so much, guys, and Doug as well. For the, for the overview. So, you know, it's pretty clear, right? Having the tools and technologies to facilitate that collaboration is critical, right, for businesses, especially in the current environment. Obviously, we talked earlier about the analytics, which also become an enabler for the success. So I want to share a couple of case studies that are going to illustrate the power of the analytics, and I want to think about a situation where— these are all real case studies with businesses that we worked with— where there was a favorable start to the season, right? We all love when there's a strong start to the season. And in this case, the supplier had alerted the retailer to the pending increase in demand due to the weather. And the increase in demand drove the increase in inventory levels to meet that demand. So in addition to the double-digit increase in comps sales, right, the order quantity that they got was significant. But from the retailer perspective, the KPI that was met was the in-stock levels, which again otherwise would have taken a significant hit. So from the retailer perspective, the win was making sure that the product was on the shelf. And I can't think of a time where that's more critical than today. If you've got stores and, and you've got retail customers that are coming into the store, you better make sure that the product that you that the customer is looking for is on the shelf, right? They're— for a lot of folks, they're coming into your store for the first time in months, right? And if the product is not there, right, it's— they're either going to go somewhere else for that item or maybe go somewhere else permanently. So capitalizing on opportunities is really critical. So this case study was a good example of that retailer-supplier collaboration. Want to move forward and talk about another example. This one's really focused focused on top-line sales. So for suppliers that are on today's webcast, think about sharing these fact-based analytics to your retail partner to highlight opportunities. So rather than telling them why you think, you know, they should, should be investing more in your product, show them the facts, show them the analytics that quantify the lift, but also identify the opportunities for specific locations. This case study did just that for a supplier of water products leading up to a key summer holiday period. So the outlooks when they were shared with the retailer drove additional orders during a peak period of the business, right? So both the retailer and supplier benefited here with increased sales. So very easy action to take. I know as suppliers that are on the phone, you're always looking for reasons and to try to get your customers to purchase more. This becomes a very simple and actionable way to do that. In a fact-based single version of the truth way. So I've got one more case study that I want to walk through today, and this one has to do with collaborating as it relates to marketing and advertising. And I'm sure for— regardless of the product that you have, right, retailers, promotions and advertisements are typically great ways to drive sales, and many suppliers are looking for as many promotions as they can get. In this case, the promotion actually didn't yield the results that were expected, right? Initially, the retailer came back to the supplier and thought it had to do with either how the customer just wasn't a match with the product, or maybe it was the availability of the product, or maybe it was the product itself. Well, it turned out, right, that they promoted a product at a time when the weather was unfavorable during the promotional period, so the product sales were suppressed. The supplier leveraged the analytics as a way to help explain that performance, which not only helped improve the collaboration going forward, but also helped deepen the relationship for future promotions so that the supplier not only worked with the merchandising team, but also worked with the marketing team to really time the promotions in a way that would optimize performance of that promotion as well as the sales for the supplier. So very simple way. I know when promotions are out there, we all look to understand how effective they were when they're done. If you don't understand the lift or drag that weather brought to that promotion, you really are missing out on a significant opportunity to understand and truly understand how effective that promotion was. So we talked about a lot of different ways to leverage these analytics, whether it's for reporting or individual adjustments. You know, if you can integrate it into a system like Shorefront, there's a great way to make it scalable, make it sustainable across all different items, all different locations. But I want to be clear, right, for, for folks that want to start simply, there's a way to do that as a software as a service environment, right? So you can get started with these analytics very quickly and meets that measurable ROI in weeks still with leveraging the Shorefront solution is a very good way to do that. But there's a lot of different ways to use it from manual to systemic to drive that value return within your business. Okay, so I did want to make sure that folks had some contact information. And again, today's examples were really focused on just a couple of sectors. Sectors in the U.S. I want to be clear, the analytics that we provide really covers all sectors of retail as well as all geographies around the globe. So please reach out, we'd be happy to share some specific insights on your business. And, and I also want to once again express my sincere thanks to Dylan, to Doug, to you, to the entire Shorefront team, as well as the Planalytics team who helped produce today's webcast, as well as to everyone in the audience who really I appreciate the time that you took with us today. I really do value the time that you shared with us because I recognize that we're all going through a period of disruption and, you know, our objective remains to help you navigate through this time. So please connect with us, follow us on social channels, reach out with any requests for support. So I want to wish you, your colleagues, and your business good health and success moving forward, and I do look forward to talking directly with you soon. I guess Dylan or Doug, are there other questions that came in today that we can address?
There's definitely a few, and thank you so much, Evan. That was a great presentation and probably a topic that not a lot of us think about other than, you know, when we're leaving our own homes every day. California, though, of course, we get about 72 like this all the time. But, you know, a few questions came in.
How—
I see you have contact information there. How can people people also, you know, use Planalytics as a partner? Do you have, you know, a variety of subscription plans? Is there anything that's free in there? Could you maybe talk just briefly about that? There was a couple questions that came in about that.
Yeah, sure. So we have, you know, the beauty around weather, right? It's constantly happening, so there's always impacts to talk about. So we are set up initially as a software as a service for folks, so it's very easy to get started. Like I said before, we partner with folks like Nielsen or NPD as a source for data for the analytics for folks that either may not have that data, but we can also do custom analytics. Folks can be up and running within weeks. And then we have a number of newsletters that go out that are targeted on specific sectors. So I would encourage you, please, to reach out. Feel free to reach out to me directly. I'd be happy to point you in the right direction. Because there's a lot of different— based on the sector that you're in, whether it's, you know, whether it's home goods or it's apparel or it's CPG, food, you know, the impacts are going to vary, but we've got analytics and solutions that'll fit all of those.
That's great, and we'll send you a follow-up information after this, so anybody that's on this call will get that follow-up email probably tomorrow with all of Evan's follow-up information there. And if you have any more questions, please go ahead and click that Q&A button, ask them in there. A couple more that came in, Evan. One was, severe weather, more hurricanes, and earlier hurricane season appears to be a new norm because of global warming. Does more weather events and seasonality give overall more opportunity to retailers and suppliers?
So the short answer to that is yes. I mean, we're in an— not only an environment where we have more volatile weather, If you think about where we are today with the advent of phones and all the social media that's out there, weather is the most local thing that impacts each of us. In the current environment, it's not only the severity of the storms, but in the current environment, people hold on— we're holding on to cash as long as we can. We're only making purchases when we need to buy them. Part of it is because of the current environment. Part of it is because we expect to be able to get goods within days, if not hours. So we expect those products to be on the shelves. But that opportunity may come about quickly through Mother Nature, but I can assure you it also closes very quickly. So for businesses that are on the phone, you've got to have these analytics to be able to take weather and rather than being reactive to what's out there, being proactive. Proactive and staging your inventory at the place and time when you know the customer is going to be coming in and looking to make that purchase.
That's great, thank you.
Great question.
They said, can you give an example of how home decor suppliers can utilize weather data and Planalytics service? So I guess to expand on that question, have you seen weather affect items that, you know, are not used outside?
Yep, so absolutely. So home decor, if I think about some of those You know, some of those categories you could say, oh, it's, you know, our homes, are they really impacted? Well, I would say certainly there's definitely are some categories that are, right? So if you think about a home decor, right, patio furniture is one of the most weather-impacted categories that's out there, right? And this time of year, right, people are spending more time outside. They're looking for whether it's, you know, outdoor sofas or umbrellas or patio furniture, those type of things. But the other thing to think about, regardless of what sector you're in, if you have a brick-and-mortar store or if you have a website, weather drives traffic into the stores and also drives traffic to the site. So the same way that we do the analytics category by category, we also do it on a traffic basis. So knowing, are you going to get more— is weather going to provide a lift for customers coming into the store? Now you're talking about implications in terms of store staffing, things like labor scheduling. And obviously, for a lot of folks, based on the business you're in, favorable weather on a Saturday or Sunday is going to be different than other days of the week. Again, it does vary by business. But it's not only for products, but it's also for traffic. And I can assure you that weather does have an influence on traffic into those home furnishing locations.
Perfect. To that, there's another question which goes along with that subject line, which is, how does weather impact the different segments across retail, such as hardlines, softlines, consumables, restaurants, etc.?
Yep, yeah, it's a good, good question. It really does vary. And also CPG, I mean, kind of that, that weather sensitivity slide I showed, it really does vary. I would say, you know, there's some categories like I just talked about patio furniture, things like heaters and air conditioners, you know, those truly are need-driven purchases. Apparel can be somewhat need-driven, but as you move through the season, you know, at some point, especially when you get to like, you know, I always like to use the example in July, customers more sensitive to apparel in, you know, March and April than they are in, you know, July and August, right? And the reason for that is because the— by the time you get to July and August, they're already acclimated to summer. The retailers, for a lot of folks, they already have fall products on the floor. But even though it's warmer in August than it is in April, you get a nice warm April day, the customer is going to feel the need to go make those purchases. So the sensitivity also changes by time of year, potentially by day of week if I'm a restaurant versus you know, maybe a home center or based on the product I sell. I mean, that's kind of the beauty of the analytics. And it's interesting, regardless of the weather that's outside, there's going to be certain products that are going to be favorable and there's going to be others that are going to be unfavorable. It's just kind of the nature of it because it's based on what we recognize the need as consumers, how we spend our dollars and how we spend our time.
That's great. And, you know, two questions that came in that are similar, which is one is how accurate is weather forecast for a month out, 2 months out, 3 months out in a quantitative way? Another question which is my supply chain requires long lead time, often up to 10 months to get goods designed, ordered, produced, imported, and distributed to stores. How will these analytics help me?
Yeah, good. I think they are very similar questions. I mean, I think we all know, right, when you're looking at your your local, you know, weather forecast, right? It really, you know, you're talking about a couple of weeks, right, with a good degree of reliability. Once you go beyond that, you know, it becomes less so, but that's not a reason why you can't do anything, right? So if I have a long lead time of product, right, and let's say I'm planning— I was planning this June, you know, last fall, right? And I know that the impact of of weather last year, let's say last year I knew that I had— I think I used the example, it was the third wettest June in 125 years. It was a very wet June last year, right? Chances are it's going to be drier this year, right? There's just no way you're going to plan your business that it's going to be a wetter June. So by removing that volatility, cleansing your history, which again, for a lot of retailers, you may be doing this already. You may be cleansing your history. I'm sure a lot of you are thinking about how am I going to plan next year, you know, in terms of all the events that happened this year. You've got to— the same way that you're cleansing your history around other variables in your business, you do the same thing with weather. Remove the weather when you're seeding your plan, and that's where you're going to get the lift or drag out, you know, 6 months, 9 months, a year out. And that's where a lot of those accuracy improvements, I talked about, that's where that's driven from. Now obviously you tune them as you get closer in, but if you're not removing the weather out of your history, you're planning on it to repeat, and it just very rarely does. You know, it's just a small percentage of the time. So you've got to put the odds in your favor, remove that volatility with these analytics, and let you improve your, your demand forecast.
All right, and then Doug, a question to you. Someone wants to know, how do they add their products to SureFront?
Oh yeah, great, great question. Without diving into each of the ways that you're able to do that here, I would encourage you to check out the platform, and we have many tutorials about how you want to add your products, whether you want to bulk import them 1,000 at a time, and plenty of help articles to help you do that. And then if you have any further questions about any of the functionality or how do I do this thing in SureFront, please use the chat tool and engage us. We're happy to help walk you through that.
That's great, thanks. And I know, you know, in our live chat tool, you know, it's everybody that works at SureFront. They're all in California. They're super helpful. So, you know, please, please utilize that once you're in the SureFront app. We're going to send that link later today as well to sign up. And great. And then the last question was I think we asked this earlier, which was, you know, comparing last year versus future analytics. You just spoke about that as well. And I want to see if you can give us any more tips to suppliers, Evan, how to utilize this for information to help them sell to their buyers, to the retailers, if maybe the retailers are not thinking about weather at all or thinking about it just in a super macro kind of way.
Yeah, that's a great question. I mean, we work with a number of different retailers, some of the largest ones that are out there, as well as the suppliers. And I can tell you, you know, working with those retailers, retailers are all— they're trying to manage their business as best as they can. As a supplier, if you can go back to that retailer, right, and provide them with that single version of the truth, some analytics, something something that can not only provide them some benefit but can really set yourself apart, right, they are more likely to take that recommendation. In addition to the fact, again, these are fact-based analytics, right? So you're calling out opportunities. In many cases, right, because the weather is variable around the country, market by market, you know, there may be opportunities where there's— the regional opportunities as well as places where there's regional risk. Every business, right, especially regardless of the product, chances are you're trying to figure out where to place that inventory. These analytics provide a way to differentiate as a supplier, as a way to differentiate yourself to help provide that guidance. I, again, I can't tell you how many times the retailers will tell you, hey, like, I'm doing the best I can to manage my business. If you can help me do that, right, I, I, it's going to build trust, it's going to, it's going to help both of our businesses grow and develop relationship and improve the way we collaborate together.
Awesome. Well, Evan, thank you so much. Doug, thank you. Evan, we're huge fans of you and your company, so, you know, we always have great chats. I really appreciate you coming on and doing this, and everybody else getting to meet you as well. And guys, thank you so much for attending. Thank you to all of our attendees. And unless you guys have anything further to say—
cool.
Then we'll end it there.
Thanks.
Uh, everybody stay safe out there and have a good weekend.
Thanks, it was a pleasure.
More from Luke

THE COMPLETE GUIDE TO PLM IMPLEMENTATION I PART 1: SHOULD YOU INVEST IN PLM SOFTWARE? (4K UHD)

THE COMPLETE GUIDE TO IMPLEMENTATION I PART 2: HOW TO PURCHASE THE BEST PLM SOFTWARE (4K UHD)

THE COMPLETE GUIDE TO PLM IMPLEMENTATION I PART 3: HOW TO IMPLEMENT PLM SOFTWARE (4K UHD)