3 policy Ladder Template & Example part 2
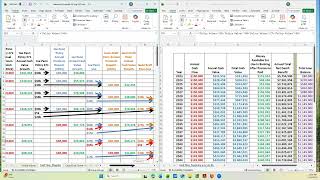
Paul Bohlen walks through Excel formulas that calculate annual cash values by pulling from the policy tab, subtracting loans, and carrying forward unused cash. He shows how to compute loan balances at 5.7% interest and net death benefits, then summarizes the workflow from policy design through cash-flow summary.
Chapters
This is part two of the ladder example and template.
If you've listened to part one, I'm. This is now going to continue for the tab that we haven't really finished going over, and that's the Cash Flow summary tab. So. And one of the things that will be easier when you actually try to follow this is to have the Excel spreadsheet, which is also provided open so you can follow the formulas and see where all the information came from.
So I'm going to. I.
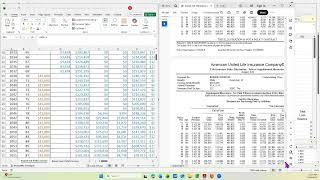
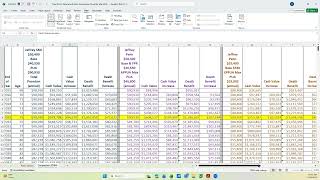
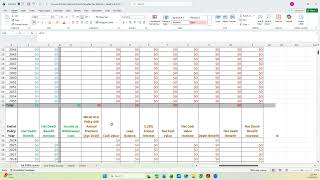
Took page two of this spreadsheet, which is the third tab, the cash flow, and I expanded it. Where this one column, total cash value or annual cash value is, is there. I hide it for the product that we use for the client because otherwise there's just too many columns and it gets overwhelming. So I'm going to have that open so you can see where the numbers come from. So on the 2023, we explained in part one where all the outlay came from. So now we're going to get to the annual cash value. So if I click on that cell, it tells me I'm using policy value H4 and O3. So I'm. I'm pulling it from the policy value tab, which I'm going to. So I don't have three things open. I'm going to show you the same thing here. It's H4 and O3. Okay, there's H4 because this pulls it from H4 and there's O3. So we're adding those two green numbers that represents a cash value. This is on the existing policy and this is on the new one that was purchased with the 90k loan. So that says there's 241k of cash value to use. How much of it did I use? I use 90k. So total cash value then is going to be this number.
Wait, go to the green column. I went to the wrong column. It's going to be this number, the 241, minus whatever we borrowed that year. And that's how much is left. And that's left that I can do other banking with. So since this is the first line, the first year, this 151 is going to be the same number here. That's the total cash value. Because remember, if I don't use the 151 the next year, I still have it. Plus I have whatever the growth is. So this column is showing just the growth on that particular year. This column is going to add up the total that's available at that point that I could use.
Okay, so let's do year two. The cash value, this says it's 228.
And that's going to be O3.
That's going to be. Look up here and you can see the formula. It's going to be E5 plus O4 plus Z3. So here's E5.
Here'S O4.
And then here's Z3. So it's those two new policies plus the original policy. I have all that cash value together. So that's how much is available.
Which one am I on?
So.
That'S that one right there. So but how much did I borrow? I, I borrowed 90 and 90, so I borrowed 180. So if I look at over here in green, this is going to tell me it's the F6, this number here, the 228 minus 90k times 2. So that means I only have 48k in addition to use this particular year because of all the new cash flow, I used 180k of it. So now there's 48k left this year added to what was left last year. And that's why the 151 now gives me 200. And then you just continue methodically going down each year, capturing all the cash values minus whatever the loans were.
Okay, so I'm going to just skip down to. Let's go down to the year that.
This is year 2028. So I'm going to go to 2028 and go to the total cash value. No, I'm going to go to the annual cash value.
It's going to be the F9. Okay, so here's F9 or correction, the F E9.
Plus 08. So that's 08 plus Z77.
That's the Z or Z7, not 77. And then I have one more policy.
It's going to be the A.J.
Oops, went down too far.
Is that one right there. So it's going to be those added together. And then I take out what I borrowed in this particular year. In 2028, I'm only borrowing 6. I'm borrowing 25 and I'm borrowing 85.
So if I look at.
2028.
It'S going to be.
There'S the 25 and there's 85 taken out. Those are the only two loans. So it's going to be the, the, the number here minus that. So that means there's 192 that I have that year left that I didn't use. So now I have to add it to what was available the previous year. So now the 523, you add the 192 and now you're up to 715.
When you get to 2029 and beyond now it's strict.
Let's see, 2029.
No, not 2020, 2030 and beyond is there's no more loans. I'm going to go to 2030.
And.
2030 is right there. So if you see that now it's, it's the same number that's there because I don't have to take away any.
Loans. So where did the 235 come from? It's going to be E11.
There's E11 plus O10. There's the O10.
Scroll over.
The Z9.
Aj 8. So it's those 4.
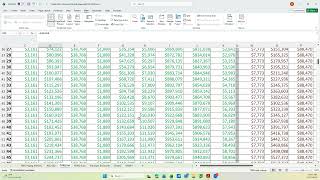
And so from then on this annual cash value is just going to be taken off the policy value tab because we, we didn't go any further here. So you get all of it from the policy value tab and you can just bring this down and it will keep those formulas and change it one row at a time.
So now I'm going to hide this annual cash value since that adds confusion to have an extra column in there. And let's see if I can do this.
Without messing everything up. So I'm going to go to home, want to go to format.
And it's looks different. So I go here and I'm going to hide the column.
Okay, now we're back to the regular way it was shown.
Okay, so you get all the green numbers and then at the bottom this adds up all the green. This was what was available in addition to what you use for, for paying premiums. That number should agree with that number because this is, this is a running total. This is an individual per year total of cash value.
So for 5.4 million I, I got access to 15 million.
Through the time frame. Okay, now let's go to death benefit. It's going to be the same thing, only what you're going to do is take out the, the loan value each time.
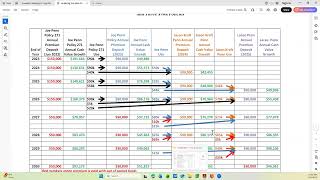
So let's go then to the loan balance which is on this side. There's my loan. Remember I did 90 the next year I borrowed more. Let me go to the flow diagram.
In year two.
Now I did two of them. So now my loan is gone from 90 and we add another 180. Then it goes up again, goes up again, goes up again, again, again and it stops in 2029. That's the last time I'm taking loans. So from 2030 on that loan balance stays you know, for assumption purposes, stays the same. And, and we're assuming that the interest is being paid out of pocket.
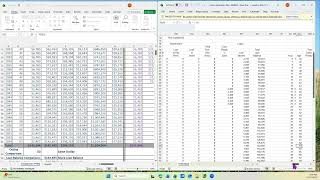
So that interest is going to be the same because it's the 5.7 times this loan balance. You know, the interest is going to change every year. And you know, the client may or may not pay the interest out of pocket. He may add it to the loan balance, but you know, it's, you know, for illustration purposes, it's built this way. The net death benefit is the death benefit of all the policies minus this loan balance. So if I get down to 29, it's got all of the death benefits then minus K11, which is here.
And then from then on it's going to be the same thing, only now the loan balance is going to stay the same. So this is a net death benefit of $22,500,000. That's how much interest has been paid. So even if you paid this out of pocket plus this, that's 7.6 million and you got 15 or death 22.
So that's the system. It's, it's got.
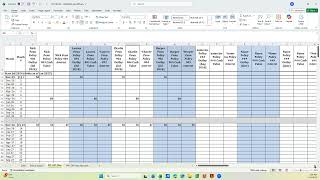
First you've got to design the policies and then add them into the policy value tab, then figure out the flow. So you build this sheet next and then from this sheet you go and build the cash flow summary. And it's easier to have that other column available when you're building it and then hide it after you're done.
And that, that's it as far as a three policy ladder. So that took assist whatever policies they had and then started three new policies with no increase of the out of pocket cash.
All right, I'm going to terminate this now and this is the end of this example.