3 policy Ladder Template & Example part 1
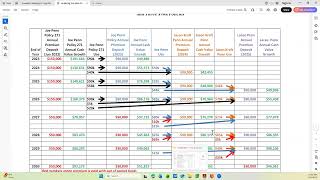
Paul Bohlen walks through laddering: using a policy's cash value to fund one new policy per year for three years. The Excel template tracks yearly funding, loans, and out-of-pocket costs across three tabs. In the example, a client pays $150,000 yearly to add $90,000 policies in 2023, 2024, and 2025, with loans at 5.7% interest.
Chapters
This is going to be a video that talks about laddering, and I'm going to use.
This particular example as both the template and the example, and you'll have the Excel file that you can refer to to be able to see in detail when you actually try to build one of these. And let's talk about what is laddering. The concept came when some clients wanted to know how could they speed up the process and get more policies in force sooner than waiting for the PUA to drop off of the first set of policies before they had cash flow freed up to start a second policy. So what we designed was a way of using the existing policy's cash value to add one policy per year for three years in a row. So they are able to go from their existing one or system of policies and have three more going earlier than they would have if they waited.
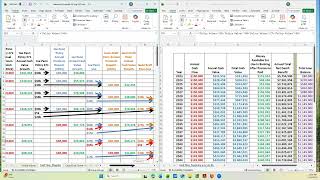
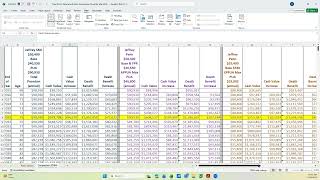
And of course, the advantage is it grows, starts growing sooner and you have longer that it will be in force. So anyway, what you have to do is decide where the client is at to start with. So what I'm going to show you here, this particular client, this was, they only had one policy to start with, but this could have been their whole system of policies. And that deposit or premium that they were paying per year was 150,000. And they said that was something they foresaw that they could continue doing, you know, for the rest of their time. They were putting money into banking. So what we knew is that was our cap. We didn't want to go above an outlay of 150k. And this is still with the PUA on it. When the PUA dropped on this particular policy, it goes down to 50k. So that means there's 100k to play with to start the new three policies. So we did, we started them at 90, we started the second one at 90 and the third one at 90. But that's with the PUA. So when the PUA drops, this one drops to 30, this one drops to 35 and this one drops to 30. So that's 95 added to the 50. That keeps us at 100 and 45. That keeps us below the outlay of 150k. So that's the first thing you have to do, is decide what, what cash flow do you have, what do you, what's your cap, how many policies you're going to add, who are the policies going to be on.
Etc. And so in this particular case, the client had in a policy that he started in 20, 22, so he was and there was enough cash in it to start the 90k policy one year later in 2023. Then here's the second new policy in 2024 and here's the third new policy in 2025. So I'm, I'm going to go back through how this whole page got built. But once we got this far, we need to now have some illustrations to have values to put into the spreadsheet. So I'm going to go to.
Let'S see if I can get to the right place.
This is.
Okay, so here's the, the part there's, there's three tabs on the policy.
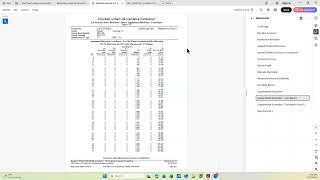
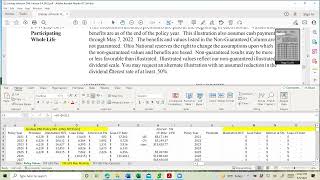
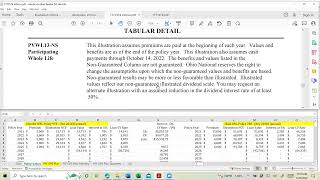
Ladder. Policy. The first tab is the policy values. That's where you put in all the things off the illustrations. The second tab is the cash flow diagram, which is what I started out with. And then the third tab is the summary so they can see what it looks like as you go down the road. So I'm going to concentrate right now on the policy value tab. It starts, you know, you put in the year that the, this particular policy started with and it was 2022. And this is set up where it's going to add all the policies below. So I, I don't put the, the information in the top. I put it down here. And this is off the illustration enforced illustration for this particular policy. There's four more years of 150, then it drops to 50. This is the gross cash value at this particular point. This is the loan value that we use for.
In this case. It's, it's going to be the same as what's here. But when you go to the next year, it's going to be the difference between year 23 and year 24. But to start with, we're going to have all of this.
And then this is what we have to work with. We're going to only use 93% of what is on the illustration for cash value to use. And then this is the death benefit. And all these are gross numbers, not, not with any loans taken out already. And so once we have that in force illustration run, we can paste all the values in this spreadsheet.
Going to back up a little bit if, if the family had more policies and that all added up to 150, this would be policy one that they had in effect. This would be policy 2, 3, 4, 5, 6, 7. So this spreadsheet is set up where you can get seven policies in their family system and you just modify it if there's more. And you only put in the data that's that's really there. The cash value is adding up. All the cash values from down here. All these values are adding up what was in each of the below cells. So that's this first, that's where we start with what happens to that information. So let's go over to the, minimize it hopefully and go to the other.
One here and minimize it.
And show you kind of walk where those numbers came from.
And that didn't give me what I wanted. Bear with me. Let's get.
I want this next to the other and I want to make it a little bit larger.
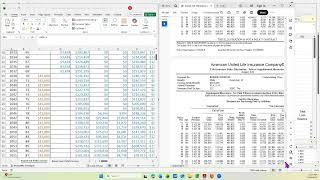
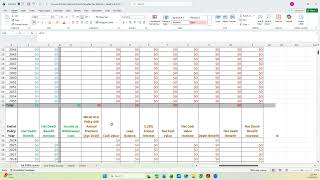
Okay, so here's 20, 23. There's the 150 brought over to this, the 191. Where did that number come from? That was here, that was the loan value. There's the 191 and we, we put the cash value in green. Any out of pocket premium we put in red. So there's the, the 191.
And then next year it's going to be 150 for the premium and then the cash value or the loan value for the next one is 136.31. You see it right there. So we, we put that in and, and all I do, I don't type it in, I link it. So this.
Cell is linked to this.
This cell. Then the one, correction, there's the one to this cell over here. Then you got the 148, 68. So and I only go down on the spreadsheet. That's the cash flow diagram. I only go as many years as it takes until all the PUA has been dropped off and it's just out of pocket based premium. So it took 20, 30 because the PUAs were on for five years. So the 90 continued 1, 2, 3, 4, 5 years. Then it dropped that policy. The next policy, the same thing, it went 94, 12, 34, five years and then dropped. And this one is 1, 2, 3, 4 or 5 years and then dropped. So when we get down to this year of 2030 in this particular example, all these red numbers are out of pocket and they're all base premium. So that's 50, that's 80.
That'S 105.
135, correction, 145.
So that's gets my outlay and I stopped this particular spreadsheet at that point. I don't, I don't go, I don't need this anymore. This is only to show the flow of where the cash comes from each time each year. So you, you can show the client where it's coming from so they don't have to wonder, okay, how did I get the cash? All right, I'm going to minimize that or hide it.
And now I'm going to slide over that. This is policy number one of the ladder. And once I run the illustration, I'm going to know who it's on, etc. And change the age if it's. If you're doing it in the future, the age of the client.
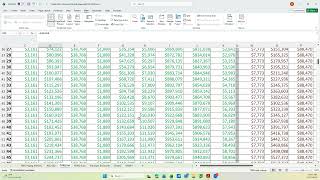
So you're getting at least projected numbers that are somewhat reliable. So there's this policy and the same thing. We have all the values. So if I look here, I want. There's my 90k and it's not in red because I didn't. It's not out of pocket. I'm borrowing from policy one to pay this premium. And the cash available after I pay the premium is this loan value, the 49, 8, 8, 9. And that goes right down. We just connect all that.
Then if you go over further now I'm going to policy number two of the ladder. It's a year later, it's in 2024, my slide. And it's going to be this 90. It starts in 2024, has cash value.
Of 42, 455 once it's paid and then it's 48, same thing goes down.
Then we have one more policy to. To do. And this is in 2025 and it's 90k. There's the 49 which agrees with this number. And you continue down taking these numbers and putting them onto this other sheet.
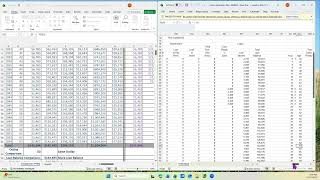
Why I'm on this one, I'm gonna. The third tab is the summary of the flow and what happens here. We also included the death benefit on this. So just to show you where the death benefit came from, it was the.
Policy values.
We're adding the.
Get over to.
We're adding F4, which is the death benefit without any loan.
Plus the new policy in 2023, plus this death benefit, which is P3.
And then we're having to take out what we borrowed because this is a net death benefit. So then here's the loan balance I've borrowed at this point in year one, I've borrowed 90,000. So the death benefit is going to be minus that. And then we calculate the interest.
And at this time it was at 5.7 was the interest rate on the loan balance. So we just did that all the way down at 5.7.
So now I'm going to go back.
To this. Okay, we have this tab completely filled out. We've got all the, the values from the illustrations, we've pasted them here and we've connected them to this spreadsheet. So all these greens are cash values that came off that sheet like I showed you.
Because 150 is the max outlay. The 150 keeps staying here in just this first policy. But when the PUA drops in 2027, it's freed up 100k of out of pocket cash flow. So I can, for policy.
One of the latter, I can pay this premium out of pocket and not borrow. So that's why you see this turning red. But that's only 140,000. I have 10,000 more that I can use. So there's my 10,000 more that's going to be used to pay 10k of this 90,000 for policy number two of the ladder.
Look at the next year. And now it's 50 and 30. That's only 80 out of pocket. So I'm going to take another 65.
And I just did, broke it up this way and another five here.
To, to come up with my 150. And this I worked because it was only 86 available and I needed 90. So I used 85 of it and I borrowed out of pocket. I did the other five the next year it's 50, 60 or 80.
There's the 125 or curse 115. And then that gives me 35 more I can use to pay this one. So now I've got all these reds out of pocket. And then the, in 20, 30 I've got red, red, red, red. So I've, I've now cleanly got all the premium coming out of pocket. So there's no more loans at that point.
So that's the significance of the reds. And there's a note here that said the red numbers mean the premium is paid with out of pocket funds. Okay, we know now where all these premiums came from. We know where the cash values came from. So the, the, the detail is trying to figure out, okay, where do I get the money each time for this premium? And that's what this column that says pen use or the policy use is. So I used 90k from this existing policy to pay this premium.
Then I used now there's 130the next year. So I used 90 and 40. That took care of everything that I had available that paid for this one. It only paid for 40 of this policy. So I had to borrow 50 from policy number one of the ladder. So that 50 and that 40 gives me the 90 so again, out of pocket is only the 150. Now I go down, there's 148 available. I use 90 to pay this one, I use 58 to pay that one, which meant I needed 32 more. So I got 32 from this policy, and then that left me 44 that I could still use to pay the premium on this one. But I was short, so I needed 46k from. I'm going to call it the orange policy. We tried to use colors to try to help see where everything's coming from.
And I'm now in 20, 26. I've got 168. I used 90, took care of that premium. I used five for this policy, and the other 85 came from the blue policy. I used 20 for the orange policy, and that meant I needed 70. And I took 70 here. And most of the time I worked backwards. I saw what was available. I knew there was 70 available, and so I needed to make up the other 20. So I backed into it and used 20 here. I knew I only had 85 available. You know, I. I don't go into the exact dollar, so that told me I needed five more. So I took five from this one and I needed 90 here. And then this has to be less than this number. And what happens to the rest of the green number? That's all available to use, but we left it as cash available for loaning. And I'll show you that on the third tab. Okay, then I'm down here.
There's no arrows for the first two because it's coming out of pocket. I've got 97, but I need 90 here. So I used 80 and I just used the 10 from here. Remember the cash flow? I freed up 10k, so that 10 meant I've covered 90k. So now whatever is left here I can use for this policy. And there's 15 left that I need in order to get the 90 here. So the loans in this case were 80 and 15 and 75 to come up with my 90s and to come up with my 90 here. We go to the next year. I've freed up some cash flow here. So I know that I all of a sudden that 60 left.
Plus this is 70.
So there's my 70 that I used here. I used 65 for this one and I used five for this one. And again I backed into it. I know I needed five because I only had 85 out of that policy. And then I knew that if I had five here, I only use five of the 70 so there's 65 available to pay out of pocket for this policy, which means I needed to borrow 25.
We go to the next year. Now this is out of pocket. Out of pocket. I did this one out of pocket. And then I come up with what am I short? I, I, I needed another 35 I could spend out of pocket to keep my outlay the same.
And that means for this policy, I need 55k to borrow. Well, I only have 40 there, so I took the other 15 here. So I took 55 total, but it came from two different policies. And then next year, remember, all the PUAs have dropped and now all of it is read out of pocket for all, in this case, four policies.
So that shows the flow up until we're no longer needing.
To borrow to come up with the premium payments. I'm going to pause this for a minute.
All right, so now I have the second tab on the left and the third tab on the right.
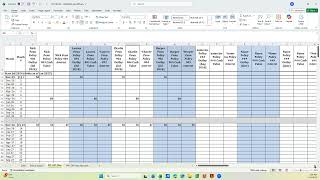
So I now have to sum up everything on this third tab. So my annual cash flow, that's the premium dollars that are coming out of pocket. And so I should see that these are going to agree with what I showed on that page here. So in 2023, there's 150k out of pocket. 150. 150. 150. So all that agrees. Now in 2027, there's 50 and 90, that's 140. And 10 is 150. So that gave me that number. Then this is 50, 30, 65. And is there more in this case?
See if I can slide over without losing this.
Okay.
50, 80, here's the 80 and 65. 145, 150.
So in.
2028, it's 150, 2029 is 50, 80.
And 70 is 150. So that shows 150 for. Then I go down to 2029. 50, 2030. I guess the last one was 2029, 50, 30, it's 80.
And 75.
So that's 145, 80. Make sure I'm adding that up. Right. And 80 and 65 is 145. So and 2030, it changes. My outlay is only 145, and that's the same outlay for the rest of this spreadsheet. And I, I went down just to that stopping point.
So that took care of my out of pocket. And this is the amount of out of pocket dollars I've spent on the policy system. The total cash value. Where do I get that from. Go back to this.
One. And the cash value there is 191.
So this is the.
Let's talk about the green. Let's do the green first. This is.
I have to put a column in here that I hide, but I do the math inside here. So I'm going to unhide it.
And let's go to format.
And.
Well.
It'S looking different because I've got it spread up. So.
Home.
Format.
Unhide, unhide columns.
All right, I'm going to.
Stop this one at this point, and this will be the end of part one. And I'll do. I'll continue here for part two. So it's not too long a recording each time. So I'm going to stop it, and then we'll reconvene for this part of it as a part two.