Paul Bohlen walks through a spreadsheet showing how a client's insurance policies grow year-to-year. The policies are fully capitalized, meaning cash-value growth exceeds annual premiums, and both cash value and death benefits compound over time across policies issued from 2018 to 2025 and beyond.
Questions this video answers
$11,400
About $17,000 (47 → 65)
2038
$86 (premium in) and $132 (cash-value growth) — units implied thousands (as spoken: 'There's a 86 in for premium and 132 growth for cash value').
Chapters
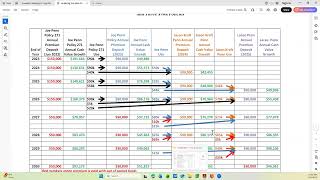
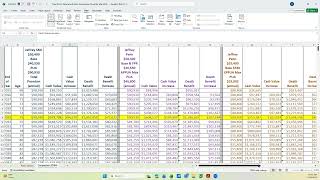
I wanted to point out a couple of things that you can see off the policy value and growth spreadsheet that the client likes to know or normally it's a question that they have. And that's how's my policy doing? So if you look at the column that says net cash value increase, we've done the math for the client to show them how much the value, the net cash value has gone up from the previous year. So like this is in year 2025. That was the cash value after they pay the premium the next policy year. And that's the premium of $11,400. That's the cash value. Well, this is the, the growth from 47 to 65. So they've got 17k more, almost 18k more in cash value with just about an 11,500 dol input. And then if you notice as you go down this spreadsheet, this increase will keep getting bigger each year even though the premium's the same. Here we are in 2038, 11, 11, 5 going in, and it's 23 plus growth in the cash value by the end of that policy year. So we're more than doubling our cash value. And the same with the death benefit. That was the death benefit in the 2025 time frame. And then here's the death benefit the next year and it's up about 3. And your death benefit normally is not going to be more than your premium early on. You can see it will eventually get there. But we focus on the cash value. And you can see this, this policy, we would say, is fully capitalized because the premium is the, the premium is less than what the growth is from year to year. So that's on that policy. Let's look at each one of them and then we'll scroll to the, the whole result. There's, we're doubling almost here. And again, that's an older policy. So let's go down to the Next. Here's one. 2018. Again, it's not quite double, but it's more than the premium. Same here.
Okay, now this is an SML policy. We've got the premium of 12 and we're getting more than 12 in gross for the cash value. This is a 2019 policy. 16 in and the growth is more than the 16.
Now we're at a 2021 policy, which is, you know, much newer policy. So here's, this is the 21, 22, 23, 24, 25. This is the fifth year and the, the sixth year when we put in 15. We have more than the 15 in cash.
This policy is similar. It's year five here put in six and I've got nine and the same here 15 I'm putting in six I got more than six and back here I put in six and I've got more than six. So what that shows is in this particular client's case all his policies are are fully capitalized and he's getting more cash value growth per year than the premium he's putting in. If I look at the summation it should show me the same thing. There's a 86 in for premium and 132 growth for cash value. The the net death benefit is even gone up as much as the premium.
And it continues to grow. So those are some of the things the client likes to hear or see is hey how's my policy doing? They don't have to wait 30 years to see it. You can, you can see it early on by just comparing them. Any particular line.