Paul Bohlen explains two types of annual in-force illustrations: one that includes a policy loan summary (showing loan balance) and one that does not. Using example policies he demonstrates where to find issue date, annual premium, gross and net cash values, and how to add the loan balance to net cash values when the illustration omits the loan.
Questions this video answers
July 2018
$15,000
Policy 178 and Policy 974974
$5,855 (stated in the transcript as 'loan balance of 5855')
The speaker reads 'loan 37401' (quoted from transcript)
Chapters
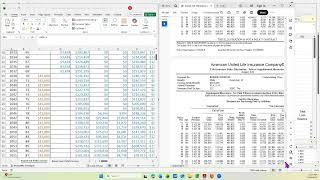
I want to show you. This is O and L in force illustration. They're both annual, but they're two different type of in force illustrations. One is the one where the loan balance is worked in the other one is where the loan balance is just not shown, not taken care of.
So.
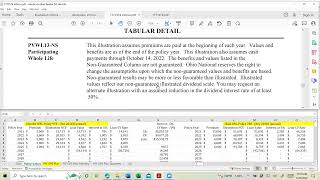
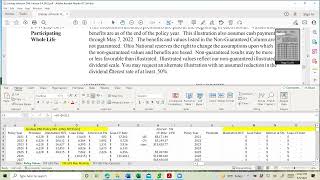
Let'S look at Policy 178. It's an annual policy. You can see here that the issue date is July of 2018. And that's what we have here. You can see that the annual premium is 15,000. This particular illustration though is the one that's the loan summary. What you have to be careful if you look at the outlay, this outlay is, is both the premium and the interest. So you can't use these numbers. For the numbers here on the GPS.
Form, you have to either go up.
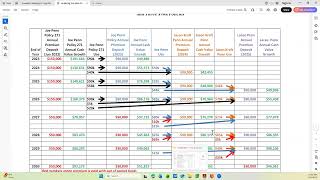
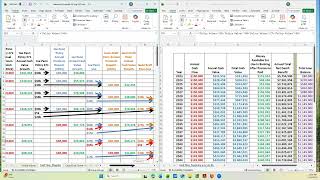
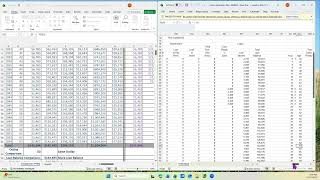
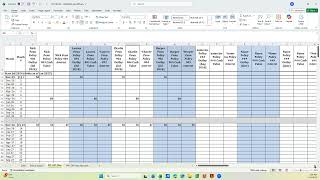
Top and see that, oh, the annual premium is 15,000 or take this number and subtract what the interest is. So that's where the 15,000 comes in. And then this is the 6,000 the year that you're in. It won't show you the premium. So you have to know what that premium was from what was previously planned. And that's the 15,000. In this case, here's the loan balance. So that's the same as what we have here. This is the gross cash value. So you can just copy and paste these directly in. You don't have to calculate the gross loan balance anymore. This is the net cash value or what the illustration would look like if you didn't use the policy loan summary 1. And to show you that this is what we've done before, same policy. There's the loan 37401. And then go down to the table.
Scroll down.
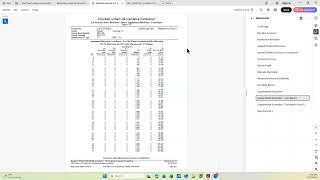
Here's the 15,000 for the two years, then the six and this cash value. That's the net cash value. So when you use this illustration instead of the policy loan summary illustration, you have to add the loan balance to these cash values. When you're calculating this as a refresher, there's another video that shows this. But I'll show you that in this other policy, which is policy 974974, it has a loan balance of 5855. So that's right here. And then when you go to the table.
Let'S go down to the next page. One more.
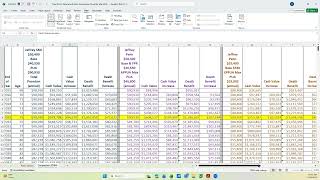
This table, there's the cash value 9857. I put it separately, I put it here. And then to get the part that goes to the gps, you take the loan balance Assuming this is the same as the illustration, you take this number plus this number to calculate that if the illustration loan balance is different than what the policy values were currently, then you use what's on the illustration to add to the illustration numbers. So what I'm talking about is this is the policy values for that policy. Let's go to the loan.
It's to be went too far. There's the building and you go far enough. Yep, I guess I went way too far. Premium page one. Looking for the loan expenses. Here we go.
This particular currently loaned is the 58555. So that value is the same as what was on the illustration. They're not always the same depending on the timing of how you got things. And here's the cash available to loan.
And that's the same thing we put here.
So that number and the one in the illustration is agree. So I can use that to add.
It to this number.
If the illustration number is different than this, I put a line that says illustration loan balance and add the illustration loan balance to whatever the illustration cash.
Values are to come up with what we need here.
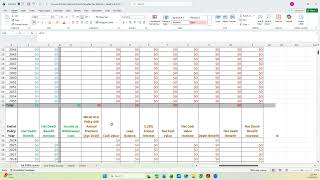
So those are the two different type O and L in force illustrations you'll get if there's a loan. Obviously if there's not a loan, you don't need a loan summary page. If you do have a loan, then getting it this way makes it a.
Little bit easier for just taking these values directly from the illustration.