Paul Bohlen walks through a spreadsheet template that lines up three life-insurance policies side by side so clients can compare cash value growth and death benefits. The template flags a key change at year 7 when PUA/FPR adjusts, then projects 30 years out with numbers that show which policy wins on cash value versus death benefit.
Chapters
You.
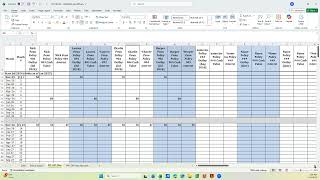
This video is an example and a template for a comparison policy value and growth spreadsheet of three different options. In this case, it's comparing three different illustrations so the client could see which one they were most interested in applying for. But it could just as easily be used as a comparison with one policy with options of that policy. For example, an as is.
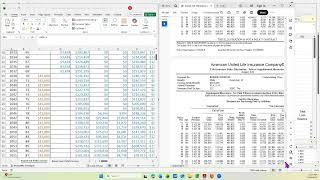
Illustration to a paid up or a premium offset illustration to a reduced paid up illustration to help the client decide how they want to go. Anyway, this has a security mutual policy on the left, a pen policy in the middle and a different pen policy on the right hand side.
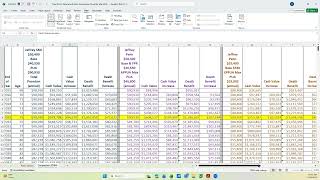
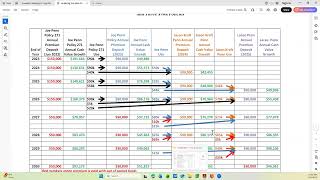
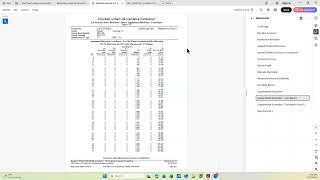
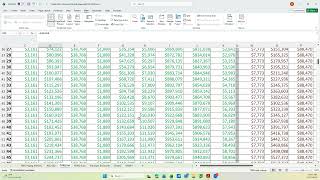
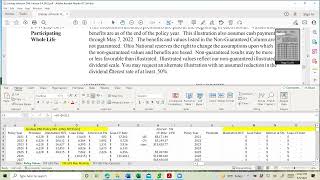
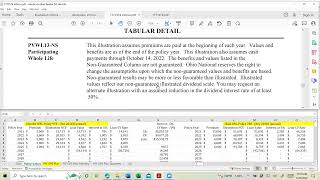
And put a year that that it's this is. These are new policies so they're not enforced. This is the year it would start and that's the age of the client. This particular client is interested in cash value and is not as interested in death benefit because they have no heirs or or an interest in leaving the death benefit to any other entity. But they are interested in having cash value that they can use for investment purposes. So the security mutual I was able to copy and paste the data for the pen policy because I didn't write it, I just had a PDF of it. I had to copy the It's a different tab. I had to copy the whole table and then once I had the whole table for the two different options I could copy from or connect to the cells here which give me the premium and the cash value and the death benefit. So that the left hand policy in the first column that I have is the total premium. That's the outlay, both base and pua. This is the projected cash value. The next column does the math for you and compares the two premiums in a given year in the next year and shows you how much the growth was for that projected premium input. And the same with the death benefit. The death benefit increase is the increase from the previous year to the current year. That's for the SML policy. This is for the middle policy. Same three or same headings. The premium, the cash value, the cash value increase, the death benefit, death benefit increase and the last one again the same values.
And then in this particular case I drew a highlighted yellow line at the seventh year to show this is when the PUA is scheduled to change on the Penn policy.
And or it's because the FPR is dropping.
So.
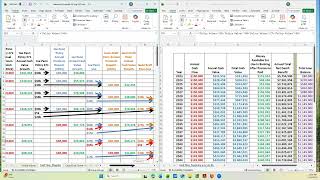
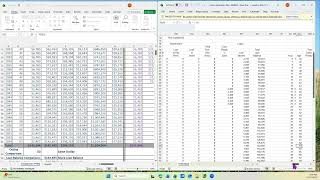
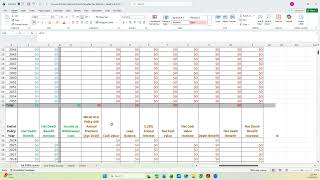
This highlights the exact same premium I'm getting in the left hand one 94k of growth and the middle one 109k of growth and the one on the right for 88k. I'm getting 102k and growth of the death benefit of 88. So that would just. You could do this on any particular line. I just. This was an example at the 7 year mark and then at the bottom after the 30 years the projections show how much premium has been put in for each policy, what the projected cash value and death benefit is at that point. And then below that I did a comparison narrative. I compared the this particular policy on the left to the one that has the least premium and the least premium is the one in the middle. So that's the difference of how much more premium was paid on the right one. Then the cash value, we compared it to this cash value to the one that had the least amount or correction, the most cash value. And the most cash value is the one here on the right hand side and that's the difference. And the most death benefit again is the one on the right hand side. So that did that comparison. And then the one in the middle, this is the least premium. And then what's the difference in the cash value compared to the most cash value.
And with the most death benefit and on the right, this one, this is how much more than the lease premium you put in. And. And it is the most cash value and the most death benefit. So that allowed the client to then look at it and decide all right, what am I most interested in and which one is the one I'm after at the.
The.
And that's pretty much. I was trying to think if there's anything else to point out, that's pretty much it. And this is to again allow the client to be their banker and and you the coach to give them some information so they don't have to go through all the illustrations and come up with their own conclusions and doing their own math analysis. So that completes this video.