3 Policy PV&G with Income Example
Paul Bohlen builds a spreadsheet tracking three life-insurance policies and how to take income as withdrawals or loans. He shows an AUL policy from 2010 where $15,000 annual income is possible, and a PEN policy where $6,000 income drops to $2,292 by 2050, then walks through combining all three policies into a client-facing summary.
Questions this video answers
March 2025
August 2010
Policy year 16
$3,428
$15,000
Chapters
You.
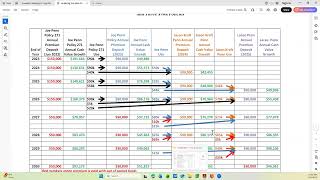
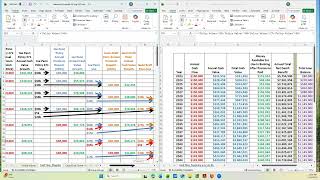
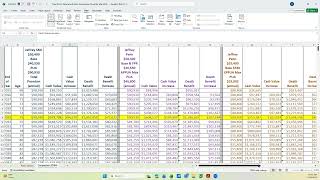
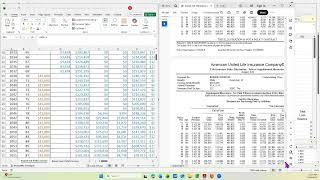
This video is to show you an actual policy value and growth spreadsheet with income as either a loan or a withdrawal. So you can see how it is built. There's another video that has the template with up to 10, I think it's 20 some policies. This one is just for three policies. Or it's going to show you three policies as that's all this client had. And I'm going to show you the the spreadsheet and then side by side the illustration that was run in order to get the details. And obviously the first thing that has to happen before you can build the spreadsheet is to have the illustration run in the way that the client wants to see it. So this particular client wanted to stop paying any more premium other than the base on some of the policies and wanted to start drawing.
Income at a certain point and then not have any more premium out of pocket either. So it was to see if it would work and you know what the rejections were. So this first One is an AUL policy and it's on the client. That's an August 2010 policy.
So in the spreadsheet put the policy year for the purposes of the spreadsheet when it starts and then the age of the client, because that was kind of what he was looking at to see. Or if I start downsizing and needing income at age 70, what does it look like?
The next common income as a withdrawal or a loan. That's blank until we start actually taking some money from the policy. The next column is the premium. And this policy, you can see the premium and it was base only, is 3428. And it's on the illustration which is next to it. There is your premium right here or your contact premium. And.
The outlay column also shows the same thing.
And then the cash value, this is the gross cash value that comes.
From this column, not the guaranteed. I got a slide over further.
It comes from the net cash value and initially there's no loan. So the net cash value and the gross cash value are identical.
And then the same thing.
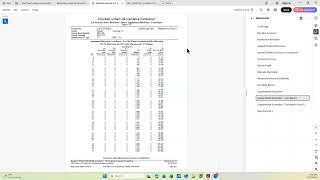
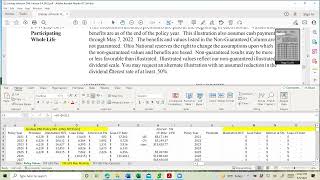
There's no loan interest or loan balance early on. And then the net death benefit is the same as the gross death benefit. If you notice, I started not at the top of this illustration. I started on the second line in policy year 16 because the illustration was run before the anniversary of the 2025. So this is the time that we're looking at on this particular illustration and you can tell that by going up here. And the issue date on the policy was August of 2010. And the.
This update was run in March of 2025. So to get the end of policy year 25.
Numbers you have to go to year 16 or the second line.
So up until.
We start taking income, this policy value and growth looks very much like the normal policy value and growth. Once there's income, then I start showing it in the income column. And we started as a withdrawal and then convert it later or take it later as a loan once it cost basis. And that's one of the options in the illustration software. So I'm going to slide over to show you where you can see that starting to come out.
Paid up addition surrenders and happened.
At age 70. And it says 18,004, 28. And the reason it's 18,004 28, he wanted to get 15,000 and or we we solved for 15,000, right. Seeing how much the policy would sustain and still be viable up until the end of this spreadsheet.
So 15,000 was income and you can see that in the total outlay was negative 15,000. And then this is 18 because you have the 15 plus the 3, 4, 2, 8 of the premium.
So I show no more premium out of pocket. So that stops this 15,000 continues all the way down.
To age. We stopped at age 88. So it stops right there on the spreadsheet. You can see on the illustration it, it can go a little bit longer, but we didn't run it past that to see what would happen. And then how do you get the loan balance and the loan interest? So with aul I'm going to go down a few pages.
This is the supplemental which shows the loan and the, the loan balance and the interest. So that's where these numbers come from. And it started at age 78. And I can see that age 78 or year.
Looks like 37. And let's verify that that's correct. So go back up here. And I started it in.
Year 29. Let's go back over year 29 is when it started.
And.
That'S correct all the way. The loan didn't start to year 37 because there was enough surrenders as withdrawals prior to that. And let's go back up and verify that. So at this point these are all surrenders until you get to the end of year 37 or age 78. And now we have to do a combination of surrenders and loans. So you'll see there's a loan starting in year 37. And let me go over there again.
Slide down.
And there's 37 and how much loan was taken. We didn't need the full 15,000 because there was some surrender value. And then that keeps going down. So that's where we got the numbers for these two columns.
The cash value, that's the gross cash value. It's going to be the loan balance plus the net cash value. And the same with the death benefit. It's going to be the go to death benefit.
It's going to be.
The net death benefit plus the loan balance. And then we do the comparisons of both the death benefit and the cash value as a for the net to see what the increase is or if there was a decrease. And obviously when you start taking out money, yeah, you're going to start seeing a decrease.
Which is what's there. So that's an AUL policy illustration. Now I'm going to go down and he had a pen one also.
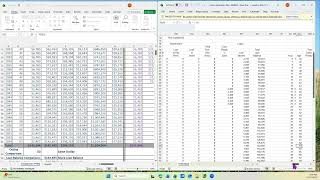
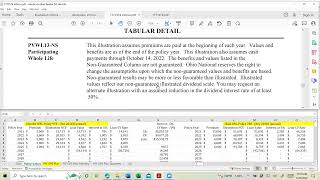
So the pen illustration looks a little different. So I want to go through it too. Get rid of this one. And remember pen I can run an Excel version and so I can copy and paste easier. So this is what it is. And I use the alternate dividend scale.
Make this minimized.
Okay. So here's my premium outlay. The and again year this policy started in 23. So that's year one, 24 is year two, 25 is year three. So that's the top line. Again, you can't see the premium here. You have to go to the premium history online. So this is how much he paid and then this is what it goes to. And then the FPR drops. So now the premium goes down a little bit further. And this is Rob's age, not the client's age. The client's quite a bit younger.
So the premium outlay continued. And then, then we're going to take 6,000 in income and also do surrenders to pay for the premium from then on. So I go down, I see my income, there's a 6,000. At some point we're going to run out of policy values. So the last year that we could take was year 2050 and could only get 2,292, not the full 6,000. And then after that there was zero available. And we actually had an input or outlay that we had to pay to keep the policy going.
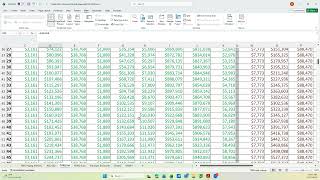
And so that's where those numbers come from. This column is straight. Okay. Then to get the interest and dividend or not and loan balance, we go to the distribution part of the spreadsheet. And again it's the alternate. And I go down and find the column that says loan balance and interest and then I copy and paste it. There's your loan balance, there's the interest.
So again, the, the gross cash value is going to be the net cash value plus the loan balance. So there's my net cash value.
Which is the 344 1. And me go over here and make sure that agrees. Good.
At the ending, the net cash value.
This. Okay. Make sure I'm on the right. That's the alternate.
21325 is where it starts.
And.
The net cash value.
Okay, is this column right here.
3182. And then the 3311 and 3441. We're down here. So there's my net cash value and then there's a net death benefit of 128.
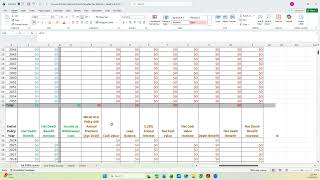
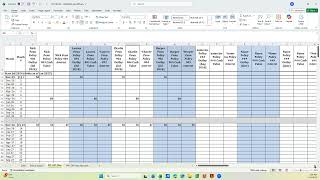
Well, that's without the dividend. We want to go over one more column. It's the 129, 776. So we've got that in there. So that's going to give us. There was another policy that was penned, but I'm not going to go through it. You read it the same way. And then that's one tab that is printed as a PDF and sent to the client. And this is the summation of both of them put together so he can see what's the total income that I've taken out of the policy. And these are projections. Obviously they're not going to be exact. And this is the, the, the remaining premium input that I have to the policy. This is going to be my loan balance at that time if I died at 88. And this is going to be the interest owed that year. And then the death benefit, it's over. So they get both the individual and the summation of the total number of policies put together.
And that's just to give them an idea. Normally they want to know, okay, what can I. Can I start taking income and have the policies last? And you could see his did this one. We're taking too much income to make it last. So he would need to do not. It's over here. He would need to reduce this or start paying more out of pocket or keep it going for this amount of time and then realize you're going to have some outlay and you're not going to have as much income when you get past here.
So that's an example of a policy value and growth spreadsheet with income.