This content was created by Paul Bohlen. This content was uploaded by Paul Bohlen. This is a YouTube video titled "Video Reading ONL Monthly Illustration" created on November 15, 2025, featuring Paul Bohlen. The video provides a detailed explanation of how to read an Ohio National In Force illustration with loans, focusing on interpreting policy values and integrating them into a GPS document for financial planning purposes.
Chapters
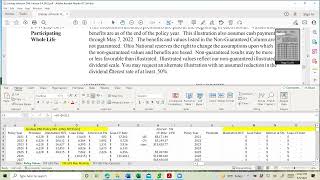
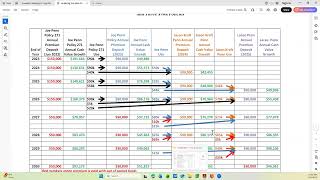
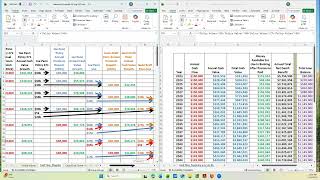
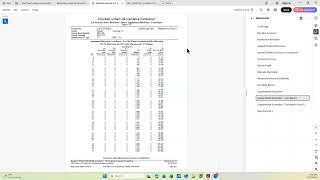
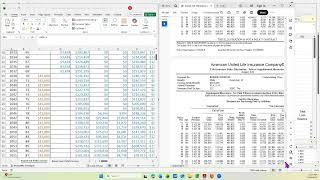
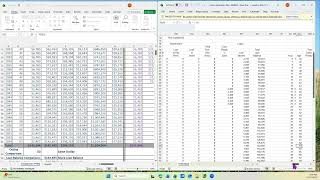
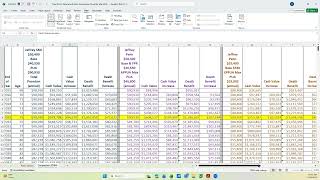
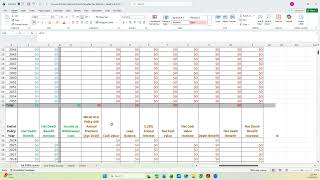
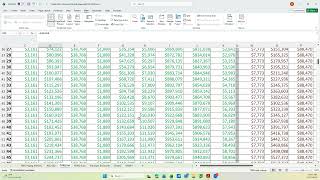
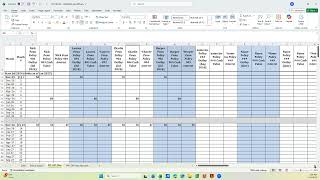
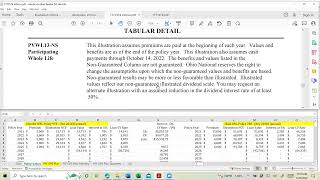
This video is to go over an Ohio National In Force illustration with loans and show you how you read the illustration and how the information gets put into the Policy values tab and the regular plan for the gps. So I have a split screen here at the top right now being the Ohio national policy, and the bottom being the GPS document, the Excel document. So I'm going to expand this first, this particular policy. What I need from it is the number I use, the last three, the three, four, nine. This date is important because I can use it to decide whether what policy year we're in in this policy. So it says it was prepared on May 4, 2002. The page I go to is the next page, and it gives me the current policy values A little bit earlier. It shows as an existing loan and what the amount is in this illustration. The amount may be different online, but this is the amount that was used in this illustration. It says that the policy was issued May 8, 2019. So I figured from that, what year we're in. 2019 is year one. 2020 is year two. We haven't actually gotten to year three. Year three won't start until May 8, 2022. So since this was written before that, all this is for year two values. So when I go down to the page that has the table, and it's gonna be right here, if I get there, there's a tabular detail. So this means it ends in year 2022, not starts in year 2022. So we're in year two, and these are the year two values. So what I do is I go to this document here, the GPS, and the policy year is 2021, because that's the starting year. It ends in 2022. Where do I get the premium? Go here, and it tells me this is the contract premium in this column or this column, 6228. And that's going to be the same for this whole time frame. There's 2022, 23, 24, 25. Okay, this is the guaranteed. I go over here to the cash value. But this is a net cash value. It doesn't say it. It just says the cash value is 5,497, but it's a net cash value. So on the GPS value sheet, what I do is I put these numbers, the 54, the 11, the 18, the 25, and the 32 down here. And I put the illustration balance, loan balance, in another cell because I want to know the gross values when I use for this tab. So to get the gross values, it's the loan balance plus these numbers. So the. And the reason I do that is we want to know the interest calculated on the full loan, not just on the new dollars. So that's why I have to have this include the loan balance this year. One number that's 90% of the 13,000. And I go over here and I look to see, okay, the loan balance on the illustration is 8171. And the cash value according to the real cash value online that they could borrow right now is 5249. That adds up to 13. I want to make sure this number is about here and not bigger than the 100% on the illustration. And it's not. So we know that things are in good order. This is then the growth that's going to be available in 2022. But that's at the end of the policy year. How do I know this is a monthly and not an annual? Because it's different if it was an annual. I've got to go up here and look for the payments. And it tells me the payments are 519 and it's a monthly premium. And I don't have to on an Ohio national. I don't have to calculate this number like we do with aul. The illustration actually gives it to me. But if I wanted to, I could go in here and I could put 519 times 12 and I would get the 6228, same as what is shown here. So either way it, it calculates out correctly. Okay, so now that got me all the information I needed from the illustration. I've got it into the Excel spreadsheet. So now I'm gonna expand this and show you how we go from here to the plan. Cause that's the next complicated part. So here's my. I know it's a May 19th policy. That's. And it's anniversary. So this is May 22nd. So these premiums are starting this May. So I went to sell four divided by 12, which go back here. Not cell three, but cell four. Then the next one is where the 5249 come from. That's the actual amount that we got online. So the first time I show any money for this year is in six months. So where did I get it? I took the growth in F4 divided by 2. So if we go down here, F4, that's the 22, that's the total growth for the year. So it's 1/2 the first six months and 1/2 the second six months. So that's where these two numbers came from. Here's the projected interest on the 100% loan, assuming it was out. And we go to the same year that we're in. So this is year four, and that is what the interest would be. You know, it can't be that high because they, there's no way they could have had 100% of it borrowed out the entire year. So we know we're safe because on the interest we're always trying to be high side, not low side. And then we just continue. This is the second half. This is the first half of. This is the first half of this policy year's cash, this is the first half and the second half of the next year's cash, and then this is the third. So all of those are six months delayed. If it was an annual, you wouldn't do this. You would just put the annual premium and they'd have all the money now plus what was there. So if this was annual, this number would be what we found online, plus these two added together, showing here. So that completes this discussion and I'm going to end the recording.