5 policy Ladder Template & Example

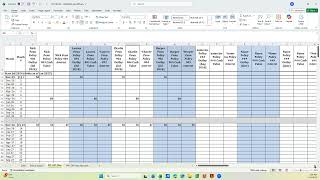
Paul Bohlen builds a five-policy ladder in a spreadsheet, starting with existing policies worth 148.21 and adding new ones from 2023 to 2026. He sequences the additions to fit the client's budget, which grows from 54,000 to 110,000 annually, using policy loans to bridge gaps until around 2031.
Chapters
This is a continuation.
Lesson on how to build ladder policies. And the, the thing that you realize is each one of these is going to be unique. It all depends on what the client's desires are and what they want their cash flow to be and, and how, how they want to do it. So there's, you know, you've got to start with something and then continue to revise it to get to the final product. So I'm not going to go into all the same detail that I went in with the three policy ladder, but this is a five policy ladder and it consists of the same three tabs. It's got the policy value tab, it's got the cash flow tab. And then the, the.
Last tab is the one that's the cash summary, you know, so you can see where everything went. So I'm going to first start with a particular policy because it's different than, than the last one in that his outlay is going to go up from what he was initially doing and got to get to the policy tab.
Bear with me.
It is.
There we go. There's the policy values. So he currently has three policies and this particular tab.
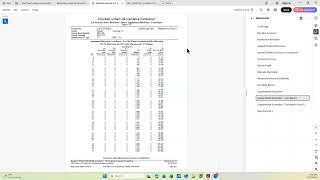
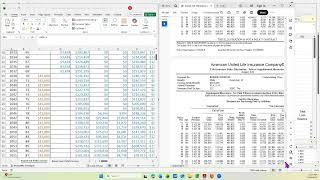
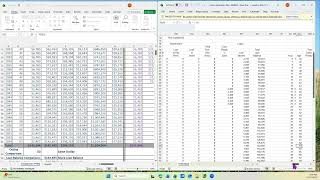
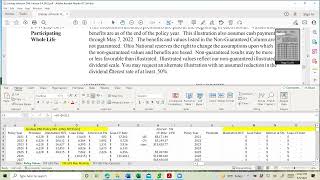
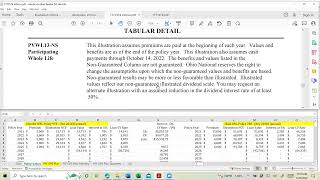
For the existing policies, the family policies are added up here. They're shown down below. So you have in force illustrations where there's one to the three existing policies. And he has loan balances, but he said he's going to pay the loan balance off.
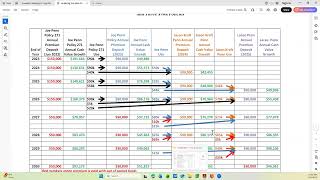
So we can use the entire net or gross cash value that the three policies have. And that's where this number 148.21 comes from. His current outlay is 54,000. He said he was comfortable going up to an outlay of 110 per year, but no higher than that. So this is in 2021 what he had. This was in 2022. He was going to add a second, a new policy to his system, but he was going to pay for it out of pocket. So that's why this is in red. So, so now he's got 104,000 of outlay by 2022. He wants to continue adding policies for a total of five of them. But he's got to start borrowing after this. So that's the next policy for a 50. The next policy is a 50. The next policy was a 30 and the next policy was a 30.
So in those numbers we kind of backed into it to make sure once the base is the only premium they're paying. The total outlay didn't go above what his target number was of the 110k.
So we do the, do the same thing as with the three policies.
You put the spreadsheet together with the policy values. You then run the illustrations for the people that he's going to insure, making sure you change your age by the policy year since it's 2022. Now.
If you're going to start this policy in 2023, you need to adjust their age when you run in the illustration. And then this is the next one, it's a 2024, and the next one is a 2025 and the next one is a 2026. So he's, he's adding all those policies to the system.
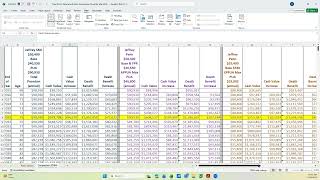
So once I have the, the values in here, then we start working on the cash flow and we do the same thing as the other one. We continue to show the annual cash value until there's no more loans being taken to pay premiums. And that takes to 2020 to 2031. There's our total premium. I calculated it out there just to make sure. So when we get to 2031, there is no, they're all red.
Numbers. And we used color codes again for the policies. We had a blue policy.
An orange policy, a purple policy, a black policy, and then another blue policy.
So we work our way through it by knowing that in 2023 he wants to add a policy, but it's got to come out from a loan. So this particular set of policies has $50,000. So we took 50,000 of it from that policy. And that's why you see the black arrow used as a loan for this policy.
The next year it, that's still 104. So he's going to have to borrow again for the 50 for this policy. But he wants to add another 50k policy. So it's over here. So where do we get the money from? And it, you know, you create, you pick the, the easiest way to show it that. So I had 50 and I had eight because there's 59 there. So I use 50 for this one and then I had eight. So that means I needed 42 and I have 42 from that one. So that gave me enough to, to resource this premium. The next year this drops. So now I've freed up some cash. In fact 17,000 of cash flow. So I know I got 17 more I can put in red as out of pocket. So that means for this 50 I only need 33. And I can take 33 from the blue light blue policy. I'm going to take an 8 and a 2. But why. So let's go over here. I need.
50 for this. Well there's 42 from here but I'm short 8. So I took 8 from this existing policy and then for this policy it's only 30. I have 28, I need another two to get it. So I took another two from this original set of policies. The next year the PUA dropped further because remember these are three policies and the PUAs may have been different because the, the issue date was different. So now it's down to 25 so that frees up some more cash flows.
So I've got 50, there's 75.
I kept this whole 50 to to do loans. Then here is 29 and the reason I did 29 is I needed 50 and it took 21 so that 29 plus the 50.
Lost it 75. That gave me the 104 which is under the 110 target.
And.
So that's, that's resource with out of pocket and policy loan. Then I have 43 here, I need 30 for this policy. That leaves me 13. If I send 13 over here that means I need 17 and there's 17 in the black policy.
Go to the next year. Now I've got this has dropped another 30. So 25 and 20 and I'm going to add this 50. So now that's 95 out of pocket.
There's 100 out of pocket. So if I use 5 out of pocket here that means I need 45 to cover the 50 and I have 56.
This one is a 30, I've got 48 so I have enough to take care of the black policy with a loan from the purple and then the next one is a.
30. I've got 26 there and I increased, there's the 4K. So now I'm still at 104 and I've got all the policies. Resourced paid.
20, 28.
See what else drops it pretty much the same.
No, this went from 50 to 20 so that freed up 30. So instead of taking 5 out of pocket I take 35 out of pocket. So that means I need 15 from the policy and I've got it. This next one I need 30 and there's enough there and the next one I need.
30, it's got 26. There's my four to give me the 104 we go to the next year. So what you see you do, you work this down a year at a time.
I'm going to skip all the way down to 2031 because now I'm down to the Point that, that one and that one. This is where we should have no out of pocket loan. Everything should be out of pocket premium.
And they're all red. That means that all, all the policies are up and running and the premiums are coming out of pocket. Have the note there. This is if we go further, you know, there's numbers there, but they don't. They're, you know, they're there because if I have to increase the number of years, I can do that. But this doesn't print out. It, it stops right at the line here. Okay, so now that I've got that, I'm going to go over here and make this one.
That, and then I'm going to make this one.
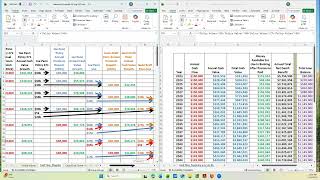
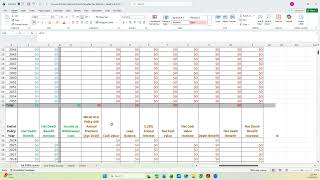
The flow. Okay, here's the 54 and then there's the 104. 104. Eventually it goes down to 103. Then when all the PUAs are dropped, it's going to take me up almost 109. So that's under the 110 limit that the client said he was comfortable doing. I unhid this column just like we did. But on the other one, the three policy ladder, just so you could see. But we hide it for giving the client the spreadsheet. Just have one less column. So this is how much is available. That green number, that green number stays the same there. The next year, there's the 47 and the 26 for the 73. And I didn't borrow anything. So if you notice there's no loan balance on the first two. The next year is when I start borrowing and then I have to do the same thing. I, I know what my cash value is and then I have to take away whatever I borrowed. So this is without the loan. This is the number after you take out the 50k.
The next year I'm going to need 150. No, you need another 100 the next year. So you see, it was 157. Take 100 away, there's 57 left. And you do the same thing with the death benefits. You add the death benefits up off the policy value tab and then you subtract the loan balance. And for the loan balance, you calculate the interest. In this case, it was 5% at the time we built this one.
And you can see once the loans are no longer needed, the loan balance stays the same and the interest stays the same. So you, you just work it down year at a time and then sum it up at the bottom. That's the.
That'S the amount of out of pocket dollars I've spent. This is the cash value that I produced, that I had access to over the time period. I remember I'm going to hide that column. So I'm going to do that now, assuming I can do it easily. And I go there and I go to format, find it. Okay, let's go to home and.
Format and hide the column.
Okay. And.
This is the death benefit. So for 4 million, I've got 11 death benefit of 17. And if I paid the million here, so let's call it 5 million 1 10,000. And you got 11. So you doubled your, your money.
And then what does it look like as a spreadsheet?
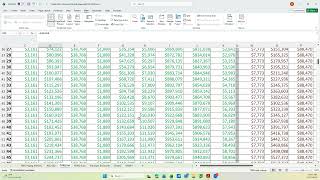
This is what the client gets. And you have to walk them through this because obviously it is pretty confusing with all the arrows and the different colors. And it takes a walk through crosswalk between page one and page two to make this make sense to the client. And then the easy thing is they don't do it all at once. They're going to do a year at a time. So you're there to coach them when they get to the next year. And they can change. I mean, they may decide that they want to have a higher cash flow or less cash flow, it doesn't matter. But you, you start adjusting based on their, their desires and situation. So this is what the whole sheet looks like for page one. And then page two.
Is this one here.
And that, that's what the client gets. They don't get the one with all the calculations. So, so this is with the three policies that this particular client had. And then he added five new ones.
Okay, that's another ladder. And as I've done ladders, I don't think I have two that are identical because be because every client's got a little different set of numbers and desires. So you, you have to build each one starting with the template. Easy, easier than starting from scratch. But then adjust as you go to make it work. All right, that completes the lesson on lad.