Policy Value and Growth Example
Paul Bohlen walks through a spreadsheet that shows policy value and growth over time. He demonstrates how to build it for client presentations, including calculations for premiums, cash values, and death benefits.
Chapters
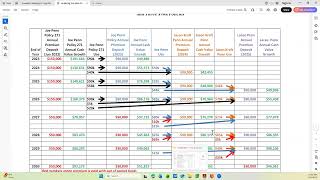
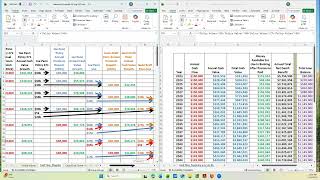
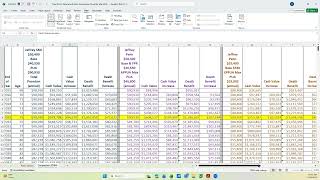
Hello. This video is going to be showing you an, an actual example of a policy value and growth spreadsheet. You know, there's another video that has a template and that's where we start is from the template to build the actual. And I'm going to show you first the finished product and then go back and explain how it was buil to get to the finished product. So you can see on the screen right now there's two different policies displayed, one on the left and one on the right. And they're different color codes to try to make it easier to see that they're different policies. And then there's two policies per page and it's a 30 year period. So that's page one.
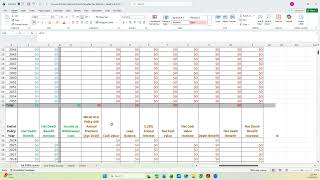
And let's get down, here's page two, two more policies, page three, page four, page five, and that's it. So with five pages, that's 10 total policies that this particular client has that we're showing the values. And this is the individual spreadsheet where you can see each policy as itself. And then the other spreadsheet that is given the client is a summation of all of the policies. And that's what this one is. It's got the same headings and all. But now this is a sum of the 10 policies with the totals at the bottom for what the values are at the end of the 30 year period.
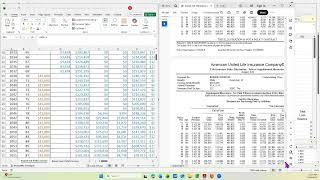
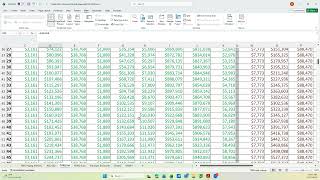
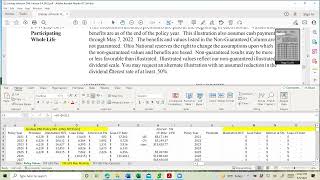
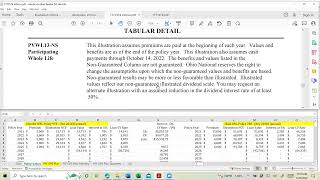
So how did we get to build that? So first thing we have to do is get the illustrations. So I'm going to go back to the actual spreadsheet and show you where we pulled all the information in. So let me get to the spreadsheet. Okay, so here's, here's the spreadsheet and I'm going to look at the policy 590 and I'm going to pick that one just because it's got a point that I want to share. So the first thing we've done is gone and gotten all the in force illustrations for the 10 policy policies. And then I transfer the information from the illustrations onto this spreadsheet. So I do them a column at a time. So this is the premium. So I know that the policy is a December 2017 policy and I'm building this spreadsheet in, you know, well after the year has started. So but I put that I want to have the end of policy year 25. So all of them start at the same year. So that means if this is going to be December 2025, I need to look carefully at the illustration to figure out where that, what year that is for the policy. So let me get to that illustration. Policy 590. Okay, here's the illustration. I go to the tabular detail, and I can tell from this the policy was issued just like we said, December 2017. So that is year one, 18 is year two, 19 is year three, 20 is four, 25 is six, 20. Well, now I lost count. So 17, 18, 19, 20, 21, 22, 23, 24 is year. So that means this top line is December 24th. So I want to make sure I take my values from the line that starts at year nine. So I'm going to make it bigger.
And I'm looking for the premium 2974. And with an AUL policy, I make sure it's annual, because if it's monthly, I have to take the monthly times 12. So that tells me 2974 is the premium. So I go back to my spreadsheet, 29.74, and rather than type all these in, I go to the spreadsheet and I copy and paste. So I can take this, hit the Alt tab.
And then go all the way down to 30 years, and then I can copy it so I don't have to type each one of these individually. So that's where I get the premium.
For this column of the spreadsheet, the cash value, and I want the gross cash value. So on an AUL illustration, get back to it at the tabular view this total, it says net, but this is really the gross. And remember, I'm using year nine, so it's 64, 889. So I go to the sheet and make sure that's 648-9889. So that's the gross cash value. Go back to the policy.
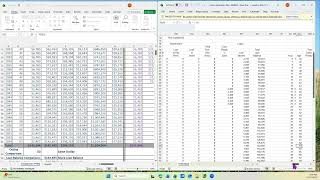
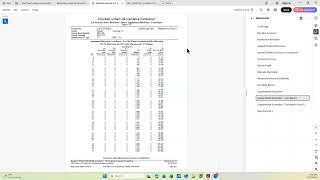
And now I want the death benefit same way, 891488. Let's look at the spreadsheet. 891488. Oops. Oops. What did we do? We went to the wrong year. Didn't we go back here, 895971. Because I'm at year 989-5971 and 895971. And again, I just take those and copy and paste them in. Where do I get the loan balance from? So on an AUL illustration, I go to the pua. Not the pua, the supplemental illustration, the loan report. And I can tell the starting loan balance was 11,571. And I'm going to take that number because I'm going to assume that they're paying the interest annually. So that's the loan balance at that moment it didn't go up even if for illustration purposes I make the assumption that they're paying the interest. So there's my loan balance and I keep it the same. I calculate the interest based on what the insurance company says the current interest rate is. So that column is calculated. The net cash value is calculated by taking the gross minus the loan balance and copy that down and the net death benefit is the gross death benefit minus the loan balance. And at the bottom I just sum up the column that's for the premiums during this period of time. This is what the value is of the loan at that ending time, the value of the cash value.
Or the net cash value at this time and then the value of the net death benefit. So that's what it looks like for the AUL policy. I'm going to scroll down and look at a security mutual policy and I'm going to pick also one. This is in April 19th. Let me see if that's the one that I that I picked here. Yes. 187. So in this particular I look here and I see that this is going to be the April 26th ending time. So that means this is my starting year for this policy and it has a loan balance on it. I'm going to make that smaller. And look down here. You.
See it's I have a cash value or I have a premium and there's my 12,000. I have a cash value 184, 870 or 821. And I individually added what was on the illustration. So I took 1, 2, 3, those four numbers and added them together right on the spreadsheet to get the cash value, the loan balance. I took the 149 and the 7 and added those together and got my loan balance, the annual interest. I calculated that.
Get to where I can show you the annual interest by the loan balance times the interest rate. And again I'm assuming the loan balance stays the same each year for, for this illustration or this spreadsheet. And then the net cash value is calculated, the gross minus the loan balance. And that should agree with the illustration.
And it does. There's the 27,798 and they may be off because of round off.
And then the death benefit is a 743,561. So that only gives me year one. So where do I get the rest of it? On an SML illustration I have to go not to the guaranteed spreadsheet but the non guaranteed spreadsheet and this assumes again no loan balance. So there's my premiums. I can take those. Here's my cash value, the203, I copy and paste that. And total death benefit, I copy and paste that. So I have all those. And, and then from that I calculate the net using the gross minus the loan balance. I calculate the net death benefit again, the gross death benefit minus the loan balance. So that's for an SML policy. Let's go look at an Penn policy. Now, Penn, when I run those illustrations, I also run it as an Excel spreadsheet. That makes the copy and pasting much easier.
So this is what the PEN policy Excel spreadsheet looks like. And I'm going to use the alternate dividend scale. So I don't. On the illustration, it won't show you the premium for the year you're in. So you have to get that from the website and you can see, you know, how much premium they paid. I'm going to minimize this and.
Minimize the other one. See if I can put them side by side.
And.
Almost had it.
Let me squish this in.
And.
Okay, so I know it was 40,000 that they put in in that first year in July of 25.
So.
Let me slide over.
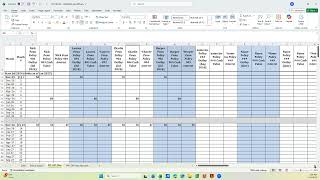
We want the alternate dividend scale. So there's my 40, here's my 15s and the rest of the premium. So I get that the cash value. In this particular case I work backwards because the pen illustration gives me the net cash value. So that's the 91,295. So I put the net cash values in this spreadsheet and I put the net death benefit in. So there's my net death benefit to 618. So I put those in and I know my loan balance. It's right here on the spreadsheet. And I, I ran this illustration where the loan balance stayed the same. So I put the loan balance in and then I calculate the gross by adding the net plus the loan balance that gives me the gross. Do the same thing with the death benefit. It's the net death benefit plus the loan balance gives me the gross death benefit. So I work backwards. In this particular case, if there was a loan on the Penn policy, if there wasn't a loan on the Penn policy, I would do it like this. There's my loan balance is zero. And I just put in the net cash value, which is the gross cash value in that case. And once I've got all 10 policy inputs done, this spreadsheet, I copy the those policies over to the summation tab. I mean, normally I start with the individual tab, I copy it so it's the exact same data for the summation tab. And then I scroll down on the template.
To the summation and make sure that this is all correct. You know, I have the family name and got the summation, the premiums. This is the loan balance of all the policies together. That's the net cash value and that's the net death benefit of all the policies. And then I print each individual spreadsheet and then provide those to the client and then go over them. So that is one example of how we go from the template for policy value and growth to a finished product to be able to send to the client and go over it with them.