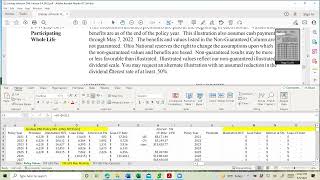
A tutorial (YouTube) explaining how to read an in-force Ameritas Emeritus annual policy illustration and how to record the illustration values into the GPS 'policy values' tab. The speaker walks through locating issue and illustration dates, identifying the current policy year (year 8, started Feb 2022), checking loan balances, recording premiums and cash values, and adding the loan balance to illustration cash values so interest is calculated on gross values. The video also notes the policy's MEC at year 47 and steps to map illustration rows into the GPS plan.
Questions this video answers
April 2022
Year 8 (policy year that started in February 2022)
$5,000 annually
$2,000 for base whole life and $3,000 for FPUR/PUA (accelerator is no cost)
Year 47 (Jackie would be 98 in year 47)
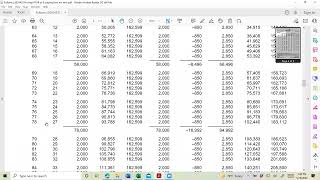
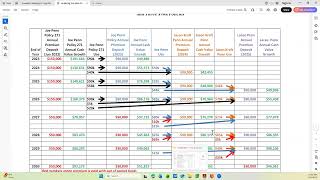
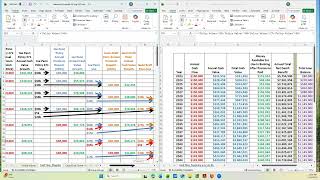
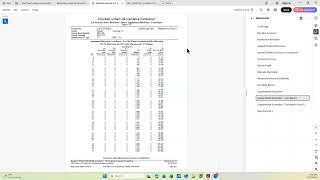
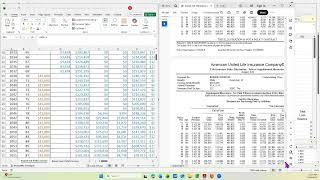
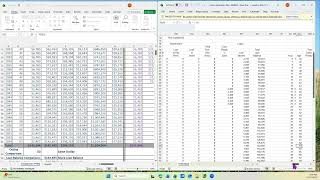
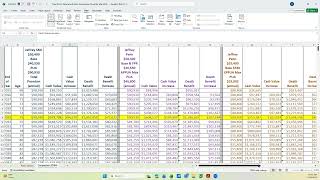
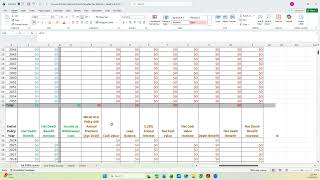
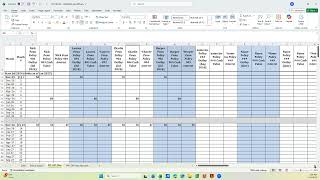
This video is going to be on the emeritus policy. This one happens to be annual and how to read the illustration and then also how to put the information in the GPS policy values tab. So this is an in force illustration and all the emeritus ones will be in force because we're not writing any new policies with them. So you'll always deal with and you'll have to get the inforce illustration directly from emeritus on this. This is page two. What we're looking for is the date of the policy, which is on the issue date. This is the date that the policy data is. But that's not the same as the date that the illustration was gotten. So if you go on page one, you can see that's the date that the illustration was run as the in force. And then they ended at a convenient anniversary time. So it's 2015. We took got in April. So you got 15, I'm counting is 1, 16 is 2, 17, 3, 18, 4, 19, 5, 20 is 6, 21 is 7. And since it's February and was run in April, it should be eight. So that's the 2022. And let's go to the tab here. And that agrees. Here's year eight. So this is the policy year that we're in that started in February 2022. Okay, go back to this. I want to know if there's a loan or not on the policy. And the loan balance will tell us if there's a loan balance. We need to add that to all the policy values. If there's no loan balance, it'll have a zero here. And then the policy values you use just like they are, you've got your policy number right here. Okay, if you go down here, you can see that they'll give you the PUR history up to the year you're in. So these are the years. And it was paid all those years from 15 through 21. And you won't know about 22 until you look at the table. And you'll be able to tell if it was paid. Here it says annualized premium is 5,000. And how's the breakout? 2,000 of it is for whole life. This is the accelerator, which is no cost. And then here's the FPUR which is 3000 annually. So these are both paid annually. You can have some emeritus policies where the base is paid monthly and the PUA is paid annually. And you can have some where both of these are paid monthly or some other combination, not like quarterly or semiannual. Okay, so I know that this has a loan Balance right here. So what do I do when I go to the table of values or the policy values on the gps? I go right here and I put illustration loan balance and I take this number and I stick it there because all the policy values, I'm going to have to add this loan balance to it in order to get the correct interest allocation or interest calculation. I'm going to go back to this in full. Go to the page that's got this tells it's going to be a MEC in year 47. I'm looking now year eight. And if you want to see what year 47 is, if you or the client are concerned with the MEC, if I go down year 47, Jackie is going to be 98 years old. So the fact that it mex in year seven is not a great concern or 47 is not a great concern to them or me. Okay. In year eight. So here's the premium that was paid in February 22nd. It was 5,000. This is the cash value and this is the death benefit. But even though it doesn't say net, these are net numbers, not, not with the loan included. So what I have to do when I go to this table is I put these values down there. There's the 22 to 25 to 28 to 31 to 34, all right there. So I put them in this part of the gps. And then when I want to go up to the values for the illustration, I add the loan balance plus these values. And if I can do it with a formula, I can do this one and lock it and then add these right to it. So this gives me the total gross values for the cash value. That way my interest is calculated on the gross numbers, not on just what is still to be available to be borrowed. I do the same thing over here. We get the loan balance. This loan balance happens to be the same as the illustration loan balance. But let's say I called now and I wanted to get the loan balance, it would be a little bit different than the illustration. So this number and the cash value would be different if I asked now because we're further along in the year. I check this to make sure that these numbers make sense. It says the loan balance and the cash value add up to 37. The 100% value is 39. So yes, it makes sense. You can see since we use 90%, we are more conservative in what we're showing the client. And then we show the growth, even though the premium is 2,000, we show the gross at the 90% is 26, 28. Here it's 3,000, which is, you know, 50% more than the premium. So they're getting $1.50 for every dollar they put in. So this, this part is done with the illustration. I got all of these numbers. And then you take these and you put it into the plan emeritus. Here's where the premium was. This was what was actually available that we got online. Then the next time you see a premium is down here. Here's the growth and here's the interest. We do it again in year three and four. There's your four, here's your three, and here's your two. Right. That completes this video.