How to build a private Family Financing GPS Request Form Part 2
This chunk is a detailed walk-through of Part 2 of a tutorial on building a private Family Financing GPS (spreadsheet tool). The speaker (Paul Bohlen) clarifies earlier terminology ("Cash Available" = loan balance), explains how to pick the snapshot date (uses the most recent prior statement date — e.g., December 21 for a May 22 snapshot), and describes worksheet tab selection (monthly vs annual). He then focuses on the debt side of the GPS: how to collect/verify client debt-sheet data, arrange debts smallest-to-largest, and use a loan calculator to infer missing variables (example: Colorado trip policy loan $3,400 repaid at $300/month over 12 months). He demonstrates handling mortgages (example: $143k mortgage, $700 payment, ~326 months at 3.75%), policy loans (charging 10% internally vs carrier 5%), building the green "cumulative funds" column that aggregates segregated deposits and extra interest, and how the sheet projects available cash by month and year. The chunk ends with exporting the GPS as a PDF and sending it to the client with a calendar link for review.
Questions this video answers
Loan balance.
December 21st.
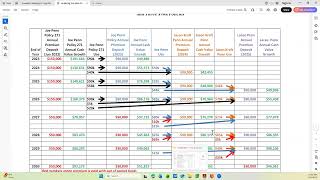
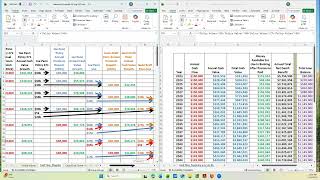
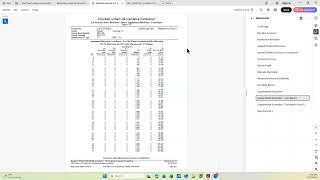
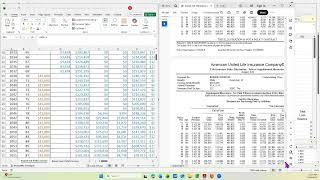
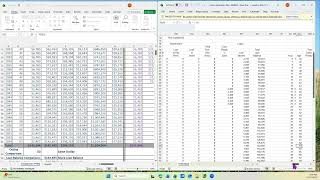
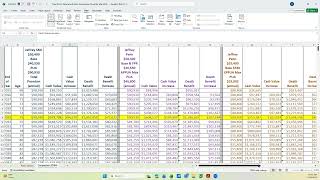
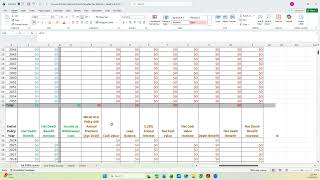
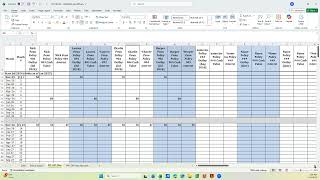
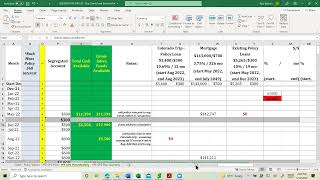
This video is part two of Building a Private Family Financing gps. And I want to add a couple of things to what I said in part one of clarification. @ one point, I called this column Cash Available. This column is loan balance. So the two things we get from the insurance company is the current policy, loan balance of all their policies, and and how much cash they can borrow because that's what we're working with in the now time. The other thing I said was how I picked the date and all their policies go back to this gps. All the policies I want to be as close to where I am now. And it's May 22nd. I said May 21st. So the closest one to May 22nd is. That hasn't already. That has occurred already is the December 21st. So that's why I picked in this case the date tab, December 21st. Another point is once I've done the policies, I have to look at the mode. If there is any monthly policies, I may use the monthly tab. If there's only one monthly policy, I may use the annual tab. So you have to make that determination. Which tab are you going to fill in the annual, the monthly, or the quarterly? Because you're only going to fill in one of them. In this particular case, I chose to do the monthly. Another point of clarification is this green column. You're going to have to add the formulas to add up the 1, 2, 3. If there was a value there, four cash values. And then when you go to the line underneath the gray, it's going to be also the four cash values for the four policies. There's four plus whatever's on the gray line. And I'll talk about this green column later on in this part two. Another point of clarification. If there's not four policies, I don't have all of these. I hide the rows or the columns rather. If there are more than four, then I go in, I will copy three. Like the next one's gonna be white. So I'll copy these three columns and then insert them after this. Blue. Cause we always alternate white, blue, white, blue. Or if there's only one policy, you can elect to do blue, white, blue, white, whatever. So we alternate the colors just to make it a little bit easier to read. Okay, part two, I want to concentrate on the right hand side of the gps, the part that has the debts. So in order to get this information, we've asked the client to give us a debt sheet and an expense. And it's got a date on it, which is where our starting point is. However, a lot of times it's like this sheet and it doesn't have all the information you need. So you have to either talk to the client, email or text the client to get the pieces you don't have to fill out. This sheet is supposed to be arranged from smallest debt, not. Not smallest payments, smallest debt to largest debt. Because we on the GPS arrange it from smallest to largest. And the reason we do that is if you take over the smallest, you start feeling success and the client tends to continue following it. If you try to get rid of the biggest debt right away and it takes three years, they may lose interest and not get there. So we, we normally show it smallest debt token over to largest debt. Sometimes it's different because there's a specific need that the client has or a specific reason that we skip that lower debt. So on this form I can see there are five things that they've filled out. One of them has known information and the others have information, but they don't include interest rate and monthly payment. So we needed to dig and work with the client to get the other parts that we needed. So what, what did we come up with? The Colorado trip with a policy loan, we figured out 3400. And now does that agree with what was on here? 3400. That hasn't happened yet. That trip hasn't taken place. And talking to them, they're planning on using the money in August. So we put a start date for that particular debt of August, and it's $3,400. And they agreed that they could afford $300 a month in loan payment. So we have to fill in the other pieces that we don't know. And we use this calculator, loan calculator to do it. So as long as I have three of the unknowns, I can figure out the fourth unknown. So I'm going to start with the amount of the loan. We know it's 3400. I don't know the number of periods. Yes, I do. I know they're going to. They want to pay this off in a year. So this one I put in the number of months. Normally I don't know that. And we calculate the number of months. I don't know what the interest rate is going to be, but I know I want it higher than the policy. So I may have to play with this a little bit, but I'm going to just do not that I don't know. And then I'm going to say the client could afford 300amonth and see if it's in the right ballpark. And it turns out yes, it gives me an interest rate that is above the policy. And normally we're looking for something in the 8 to 12% range. So that's why this interest rate is so odd. Normally the client gives us the interest rate because they're already paying a debt off and we take that interest rate and start doing it. So this tells me in 12 months I'm going to pay it at $300 a month. So I fill that information here. My first payment is going to be August of 22nd. My last payment for when it's no longer going to be paid to myself is August 23rd. So what I do with that, Let me get this out of the way. I put a red zero in the August line to say I don't owe a third party. I've spent the money and I'll show you how I take the money in just a minute. And that means I'm going to start paying myself $300. If. If it was 300 in July and I add another 300. That's why it says it's now 600. And then I put a note here and I'm going to make that a little larger. Use the policy loan to take Colorado trip. But third, assume paying off credit card at trips end in August and add that payment to the seg. So that's why the 300 went in there. If I go down it should stop in August of 23. And we put a note last Colorado trip payment in July of 23. So that's why it went from 6 to 3 in the month of August 23rd. So that took care of the Colorado debt. Go back to the debt sheet. That one is gone. Let's go back to the GPS and see what the next debt. The next One is a mortgage 143. And we didn't have the information on the debt sheet show you that again, we just know the mortgage was 143 and we knew that the payment was 700 and that the interest rate was 3.25. So we've got most of the information. We just don't know how long it is. And this is supposed to be principal and interest. Sometimes the client give it to us with escrow and if it's with escrow it's going to make it look like it's going to pay off a lot sooner than it will because escrow does not reduce the principal of the loan. So I'm going to Go back to that same calculator and go. I'm going to put the loan is 143,000. I don't know in this case the number of periods. So I'm going to delete that. I know the interest rate is 3.25 and I know the payment is 700. And then I hit calculate and it tells me it's going to be 298 months if I'm reading that right. So I go back to the GPS and I think I put the wrong interest rate in because this is 3.75. Let me go back here and double check 3.25. I want this to be 3.75 and now calculated. And now it says 326 months, which agrees here. So I'm starting it in May and I put a note on the GPS in the beginning column that we're starting the GPS in December. But the debts are as of May. So I know where I'm counting from when I start looking at balances. So this is a May balance and it's 700 months or $700 and it's 326 months. How do I know the ending time? We already have it built in here. You put the starting date of the debt. You go to this red block and you put in the number of months in this, this case having trouble reading the forms. Number of months are 19. So I want to stick, not 19. I want to put 326 and hit enter. And now I see that the ending date is July 49. So that's how I know what this is. And if this GPS went to that point, then I'd have a note like I did on the first one, that the last mortgage payment was in this particular month. And then for this debt is going to be there if they have existing policies and they have loans. And sometimes they'll tell us they're paying themselves, sometimes they won't. And we'll do an approximate at 10% of cash flow. And then when I go over it with them, we adjust if that cash flow is too low or too high. So we know from this form, I get back to it, that that's their loan balance. From the form here, they tell us they have a loan. They don't tell us and there's what they did for did with it. They don't tell us how much they're paying the insurance company, but they say they're paying, they're paying the insurance company. They don't pay their segregated account. They pay directly to the Insurance company and they give us that they're paying 300amonth. So we got that number from them. So what we do is we go back here to the GPS and we put. There's the balance, the 300amonth. The policy loan is at 5, but we're going to charge ourselves 10 and pay ourselves extra interest. So we calculate using that same thing here, we go to the loan balance is 5265. We don't know the number of periods. We're going to do it at 10%. We know we're going to pay ourselves 300. And we do calculate and that says 19 months. Then I go to here and I put a 19 in and that says the ending month is December 23rd. So that told me this number. I put the red zero in May because this is a balance as of now, the mortgage. This is the balance after one month's payment. And we use the formula for that because the debt sheet. Let's go back to the debt sheet is May 3rd. We're assuming that sometime this month they're going to make a payment towards that 143. So back to it. So this includes the first payment. And using the financial calculator, piece of Excel, we've got the interest rate, we've got the current balance, the monthly payment, and it's paid at the beginning of the month. So this and there's one month. So that's the balance at the end of May after they've made the one payment. This particular mortgage we're not going to take over. So it continues down the sheet and it's gone 31 months by the end here. And that's the projected balance, assuming they've given us all the correct information and they make their payments on time. So I go back to the debt sheet and make sure we didn't miss anything. These are the two loans they took out. It adds, doesn't add up to the loan balance. So we don't try to reconcile that. You know, they may have used a little here and there's no number. We know what the real balance is and we know from them what they're paying themselves. So we just, you know, calculated these three are all included in this existing policy loan. Okay, so now that we've got that, we make sure we get this green column, the cumulative funds figured out. If there was a starting segregated account balance for a person that already had a policy, we would have put that in here as a starting number, a note, segregated account, beginning balance, and the cumulative they would have had if this was $100, this would be 100. Here's all the cash that they have from the three policies. And if this number is the same, that means at this time I didn't use any of those dollars. So they remained the same. And I put a note that said that the funds were added to the cumulative. The one thing that we didn't do or they hadn't been doing is showing the 300 going to the segregated. They're putting it directly into the insurance company. We show it always going to the segregated. So we can show all the new dollars from the policy not including any loan repayments. So here's the 300 that they're paying themselves right here. That 300 is included in the gray line because this gray line adds up all the segregated deposits for the previous six months. If it's a monthly like this one, it's adding up to 300 and then the 600. So that's how much was put in. So when I get to this cell, it's going to give me the 300 that's there plus any dollars from any of the policies. And there's one policy that has money. So that's a 1206 add. 300 is why this is 1506. And again, since I'm not using anything on this month, I take the 1506, I add it to the 11 and it gives me the 12, 900. That's how much I have available to use in August. We know he's going to use money for that trip. So that's why the balance went from 12, 9 to 9, 5. Because we spent this $3,400 right here. So the red zero means I don't owe a third party. I've got this payment going to myself. Myself is a segregated account. I continue down, this adds up to 3,000. I have some policy dollars. 1, 2, 3, 4. All four policies have some money that plus the three adds up to the 12, 6. Since I didn't have another use, the 12 six gets added to the nine. And now I have 22. Since this is now 12 months down the sheet, this gray line, and I've been paying myself extra interest, we calculate well, how much is the extra interest you've been paying yourself? Because the goal is to take that extra interest that's in your segregated account and add it to a policy or among policies as extra paid up additions so that you get growth in your policies from that extra interest. So we calculate this for the client. We don't give them the calculations, we do it, you know, down below and give them that red number. But how I got it. That's the 300amonth at the 10% that is being paid right here. And I'm going to freeze this top line just so it's easier to show you. I'm going to freeze the top row and go here. So I'm paying 300amonth. It says my interest rate is 10.69 and it's for 12 months. So that agrees with what I said. I'm paying. The policy is at 5%, so that's only 291. So that means every month there's nine extra dollars in interest. That's going into your segregated. So in year one, there's four months of those extra payments. So I go back up here, there's 1, 2, 3, 4. Correction, it didn't start till here. So 1, 2, 3, 4. Because that's my first payment of that debt. This section, there's six of them in this section, there's only two. So here's the four, here's. I said six. There's six and two, which is eight because this is by year, not by semi year. So between, slide up between this gray line and this gray line is 12 months. How many of these $300 payments were made in those? Two? There's six of them, seven, eight of them. So that means there's $36 extra in year one, $72 extra in year two and the payments stop. So there's no extra dollars in year three. Did the same for the policy loan. This is the balance at the 19 months at the 10% rate. This is at the 5% rate. That means there's an extra $12 per month of interest. It's going to go for 19 months. So here's seven of them. And here's the last 12 because this is going to end in December of 23. So there's 12 of them. Let's make sure we ended it. So last policy loan payment is in November. So there's no payment starting in December. So that's why you see the segregated dropped off there. Okay, so now we have the individual loan extra payments per month. Now we add how many debts that we are paying extra interest on. We'd add them all together over here. So that's 36, 84, 120. It's a nice round number. So we just use it. 120. And that is where this red number came from in the first year. 120 right there. $120. And then we need it for the second one it's 215, so that says 215. And the third one we left blank because at this time there is no extra interest being paid because there were no payments to the segregated. So we don't, we don't subtract this money. We just advise them that out of this 2,400 they're going to take 215 and try to get it in as extra premium. But they call our office and ask which policy or how much each policy will hold and the insurance company will tell us how much it will take without becoming a MEC. And as long as it can take 215, then we put it in. If they give us a bigger number, the client can always put in up to that bigger number. They just can't go over that number without having it mec. So this cumulative funds is a running total every six months. This total cash available is a one shot month use of money. That's how much is available in that particular month. Obviously the reason it keeps going up here is we're not using it. So this cumulative funds available column at the end of the 37th month that tells the client that's how much currently is projected to be available for other uses. If you only follow the plan that we have laid out here. So we took care of all of this. We've got the note column full filled in to show what happens each year. We've got the red number for how much extra interest. We've accounted for all the cash and it's building. So that completes the gps. We've got the left side done, we've got the right side done. And then we've got the green which is really the key parts of it to know what is available and how is it being used. And then we print this as a PDF and we send it to the client along with a calendar link on my calendar for them to schedule a time for me to go over this GPS in detail and answer all their questions. So that completes this video.