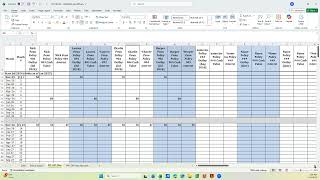
Paul Bohlen walks through a spreadsheet for tracking up to 13 insurance policies over 30 years. The template has separate tabs for individual policies and a summary view that aggregates cash values and premiums, pulling data directly from insurer illustrations.
Chapters
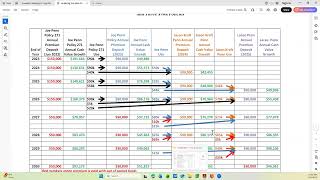
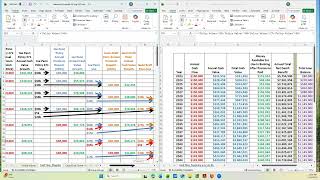
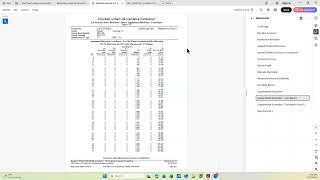
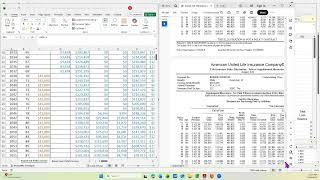
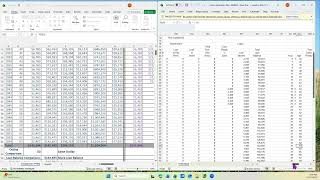
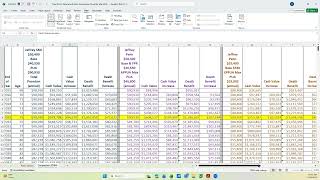
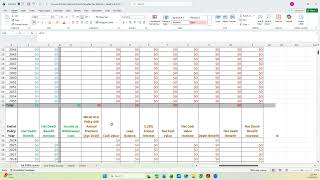
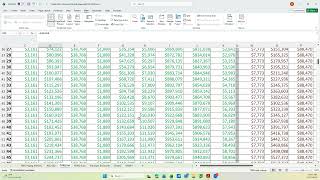
This video is about the template for the Policy Value and Growth spreadsheet. And you know, normally when I build one, I start with the template and then I adjust the template to fit the situation. This template has the place for 13 policies and there's two tabs at the bottom. One is for each individual policy and one is, is for the summation. So I'm going to start on the individual tab and what you'll notice is column A. There's the. This is the end of policy year and you have to update this depending on where you're at. For this client, you know, this one was started in 2024 and it gives you a 30 year snapshot of what the values are that we're going to use. And before you build this spreadsheet, you have to get the in force illustrations for all the policies that are involved. This is column A, column B is hidden. But if you want to see column B, you just go over to your format and you unhide the columns. And this column B is for age. Sometimes it's a. It seems appropriate where you want to put the age of the client. This normally works when it's the same client for all the policies. Because this is the age for this person's policy. I don't have a column over here for the other person's policy. So normally I don't use this particular column. And then for every policy we've kind of color coded it just to make it easier to visualize because we print out two policies per paper. So this is policy one and this is policy two. So you go up and you edit the policy information for this first policy and you do the same with the second. And then you cut and paste or copy and paste from the illustration the premiums. And remember, if it's an AUL policy, you have to calculate it if it's monthly, it's the monthly premium times 12. Because the illustration gives you the annual cost, not the annual cost for a monthly policy. So you normally copy and paste the premium. You get the. This is the net. This is not the net cash value. This is the cash value column. And you get that off the illustration. And this is the gross cash value. So you have to know your illustration to know if that's what it's displaying or if you. You have to calculate it by starting with the net cash value and working backwards. So this is assuming I had the gross cash value in the illustration loan balance. You have to put it in. I normally calculate the interest based on what the insurance company says. The interest is for that particular policy. So this loan balance, if you type a number in there, let's make it 10,000, you'll notice it calculates the interest. And this is with the formulas. If it was 5% interest, you would change this to be whatever the interest rate is for that particular policy. The net cash value column is calculated based on the cash value column minus the loan balance. So that's why this says minus 10,000 because it's zero, minus 10 is minus 10,000. And the next column calculates the cash value or the net cash value increase. But it doesn't start on the first year because you don't have a zero year to look at. So it starts from the second year on the spreadsheet and on. So like this is automatically there. If the net cash value was 10,000 and this was 11,000, then it would show an increase of 1,000. The death benefit. Again, you copy and paste it from the illustration and then it calculates the net death benefit and the net benefit increase. So you do that for every policy. And this template is set up for 13 policies. If you have more than 13, you have to insert rows. If it's less than 13, you just fill in the policies that you do have. And then you adjust your I'm going to go to print view. You would adjust your printing where you wouldn't print all 13 policies, you'd only print the ones that you had. So that's the individual page. And then what I normally do is copy and paste that into the summary page, which is, which is this tab. So I don't re type everything in, I just take it from the first tab and paste it in here. But the difference with the summary tab is when I go to print it, I'm printing out just the summary page, which is this one down here. And I would put in the, like it was the Boland family. I put Boland family total annual premium. This is adding up all 13 policies values and putting it in this one spreadsheet. And when you go to print this one, I'll do print. You'll see you're just getting a one page printout of just the summation of all the policies this particular client has. So this is a 30 year look of all of them. And the first tab is a 30 year look of each individual policy. And there is, you know, from this you can do other variations where you can come up with income, you can, you know, adjust your policy value and growth as the situation determines it's needed. So that is the template and I'll show you what a real completed one looks like in a separate video.