A short instructional video by Paul Bohlen explaining how to read a new MassMutual (MAS) life insurance policy illustration, locate premiums and cash values on the COVID/MAS pages, and transfer those figures into an Excel plan view. The presenter demonstrates identifying monthly vs. annual premiums, extracting non‑guaranteed total cash value (90% available), and shows how to map effective dates and monthly/half‑year allocations in the spreadsheet. He also explains assumptions used for loan interest and conservative projections.
Chapters
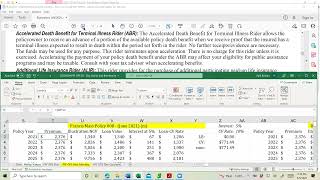
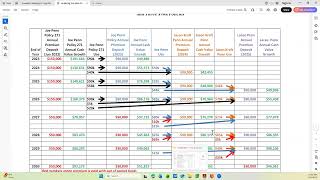
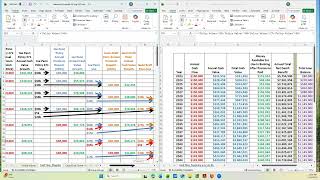
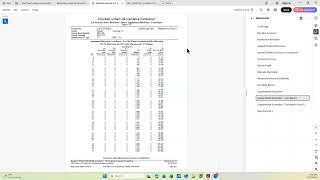
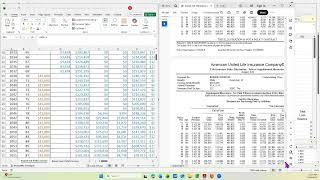
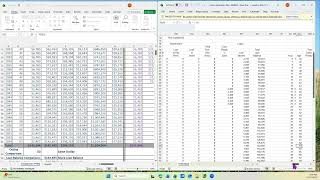
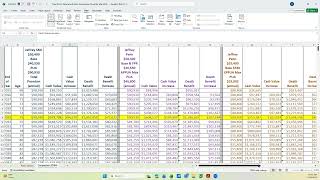
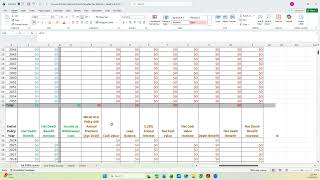
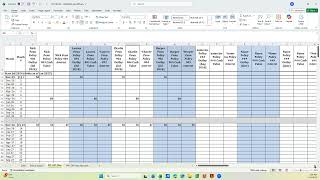
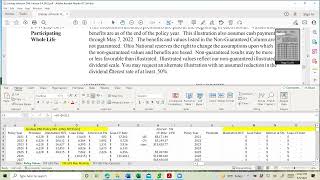
This video is going to discuss a mass mutual policy that's new with no loan and how to read the illustration and then how to get the numbers to put on the Excel spreadsheet for the gps. Okay, I know it's a MAS policy because it says it here. I know it's on Francis, this is the COVID page. So I've got it on Francis and it's a May illustration but the effective date since it's brand new I have to get that either from the MAS site or Infusion. And this particular policy was effective June 2021. So that tells me this and it gives me my starting point here to get the values I'm going to go down make this bigger so you can see the whole page at once and click down a few pages. This I can see the age of the individual doesn't give me anything useful yet that I'm going to take. So I go a few more. I'm finally to the COVID page of the illustration and let me look at something. Is okay no, because this is still before the the policy number was assigned to it. From this page I can see it's a monthly premium and it tells me 198 monthly. So that is what I want minimized. I want the to see here. 198. Well there it is 198 times 12 or 2376. I go down further to the actual table which is going to be a ways down and we're right here. Okay, this, this gives me if I was going to pay it annually that would be the total payment. If I'm paying it monthly, this is the total payment. And you notice the 2376 that agrees with what we have here. That also agrees MAS with what's here. So this will be the monthly total. If it was paid annually that total would be this number. And this also gives you the breakout of what is base, what's alr, ALIR or pua. And so to get my values I go to the non guaranteed. I go to the total cash value end of year and I get these numbers here and I can copy and paste them assuming my Adobe will do that on this illustration. So that gives me the numbers here. This is the 90% this cash value I got from online on Massachusetts, the MAS website. So that's how much is available of this total for the year. Does the number make sense? I'm almost near the end of this policy year and and this seems rather a little bit conservative but it could be. There's a May and a June payment still. But anyway, it needs to be less than this number, certainly not more than this number. And it looks like it makes sense. So now how do I take what's on this sheet, maximize it, and then put it in the plan view? So I go over here to the plan view. This is the mass. Here's the 198. So it started in June 21st. So that's going to be cell T3 divided by 12, which is T3 divided by 12. And it should change in June to be T4. Let's see if we did. So if I go down to June, that's T4. And then rather than show the little bit of money that was there, now we showed all of the first year's money right here in June. So that is this projected number right here, which is still conservative, but it's higher than the 771. Then for the next, we're going to take these and always divide them by two, just like we do on other monthlies. So, so I've got this one is going to be four divided by two. Four divided by two here, this is going to be five divided by two. And you notice it should be going up and it is. This should be five divided by two. This is December. This is six divided by two. Just to verify it, year six, or it's row six. This one right here, that's 2024. It started in June of 2024. So the first time you get the first half is December 2024. The interest you get right off the other tab. The other calculation, 67, which is 100% at 5% interest. So there's where the 67 came from. And these interests, we're always assuming 100% of the money is borrowed out the entire 12 months. That way this number is always higher than what the real number would be because they're not going to get their dividend to the end of the year anyway. So you're giving them a projection. If they're prepared for this, what the real number is will always be less. So, so they'll easily be able to pay it. And we recommend they pay the policy interest out of pocket. If they do, then they have all these dollars to use. If they don't, then whatever the interest charge is is added to their loan balance. And then they have less to borrow because part of it was used for the annual interest. So that completes the explanation of a MAS policy. And so I'm going to close this video.